County Maps
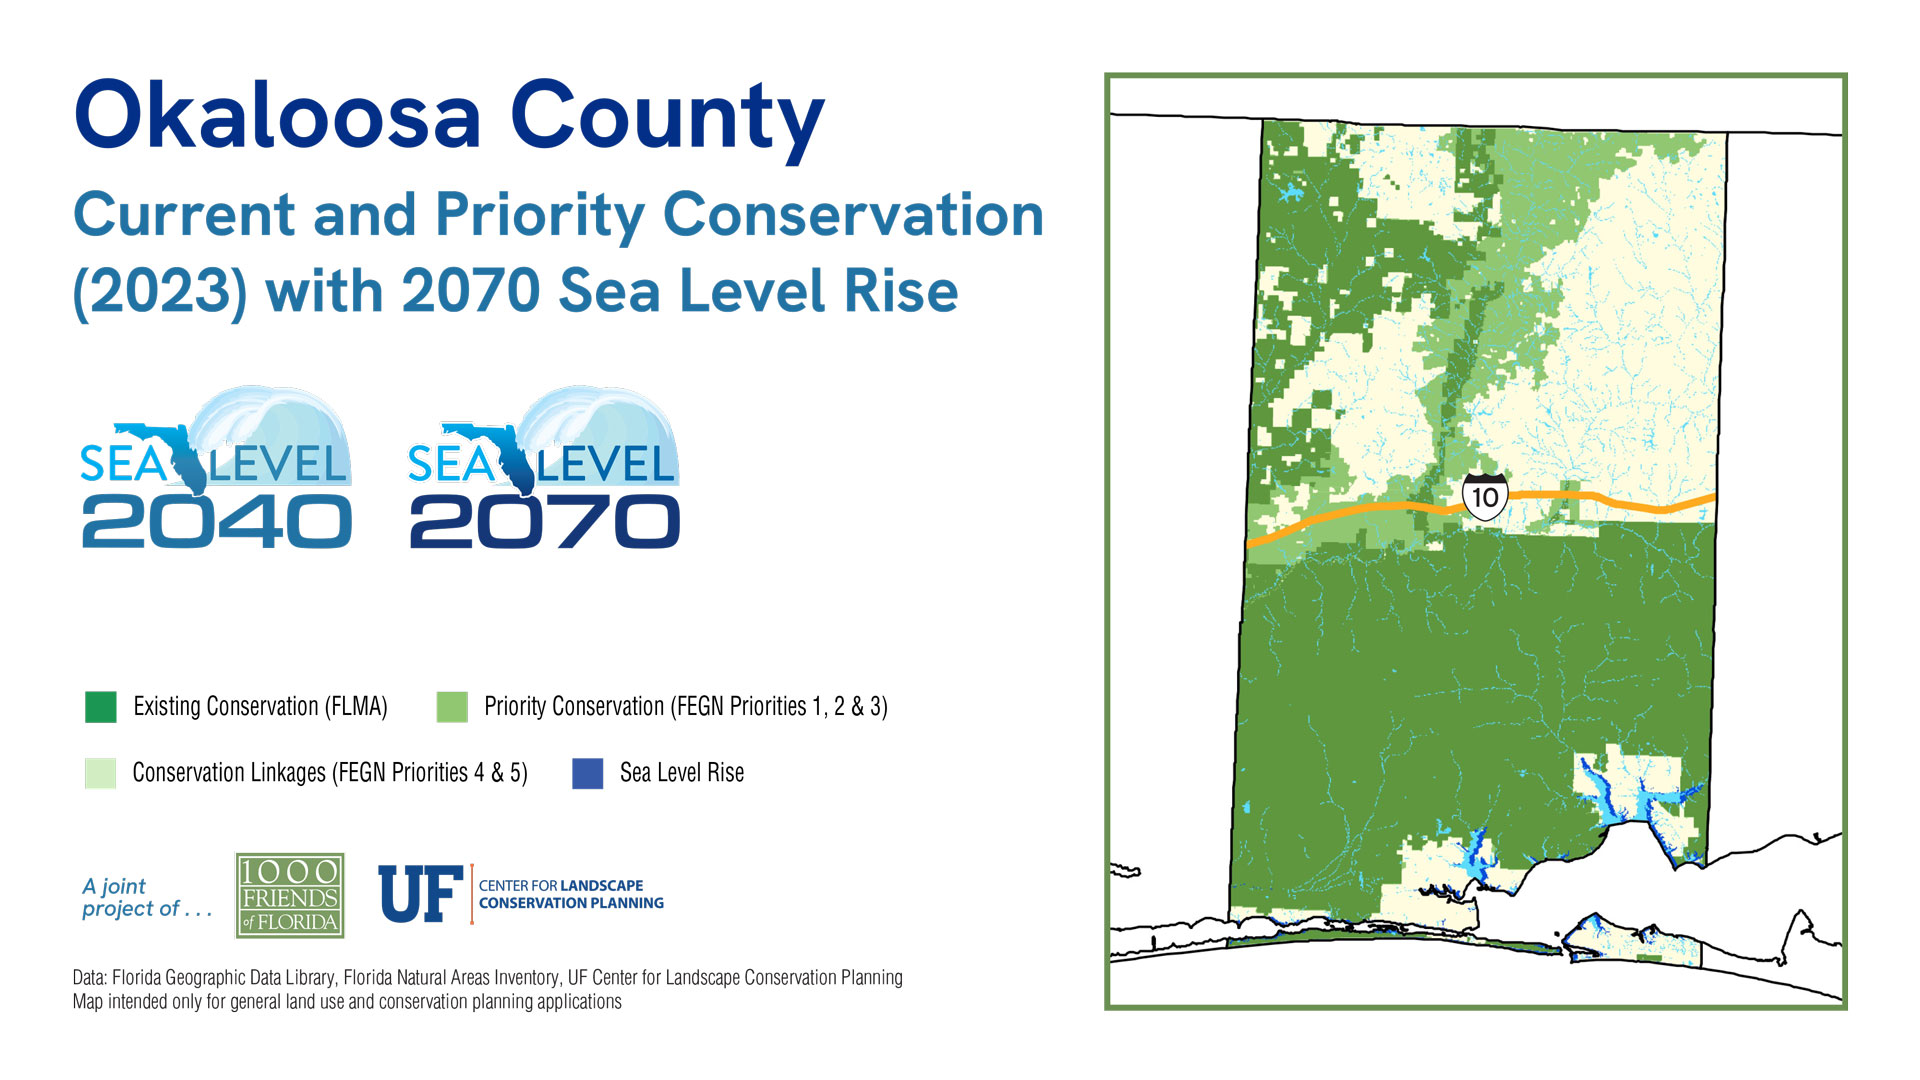
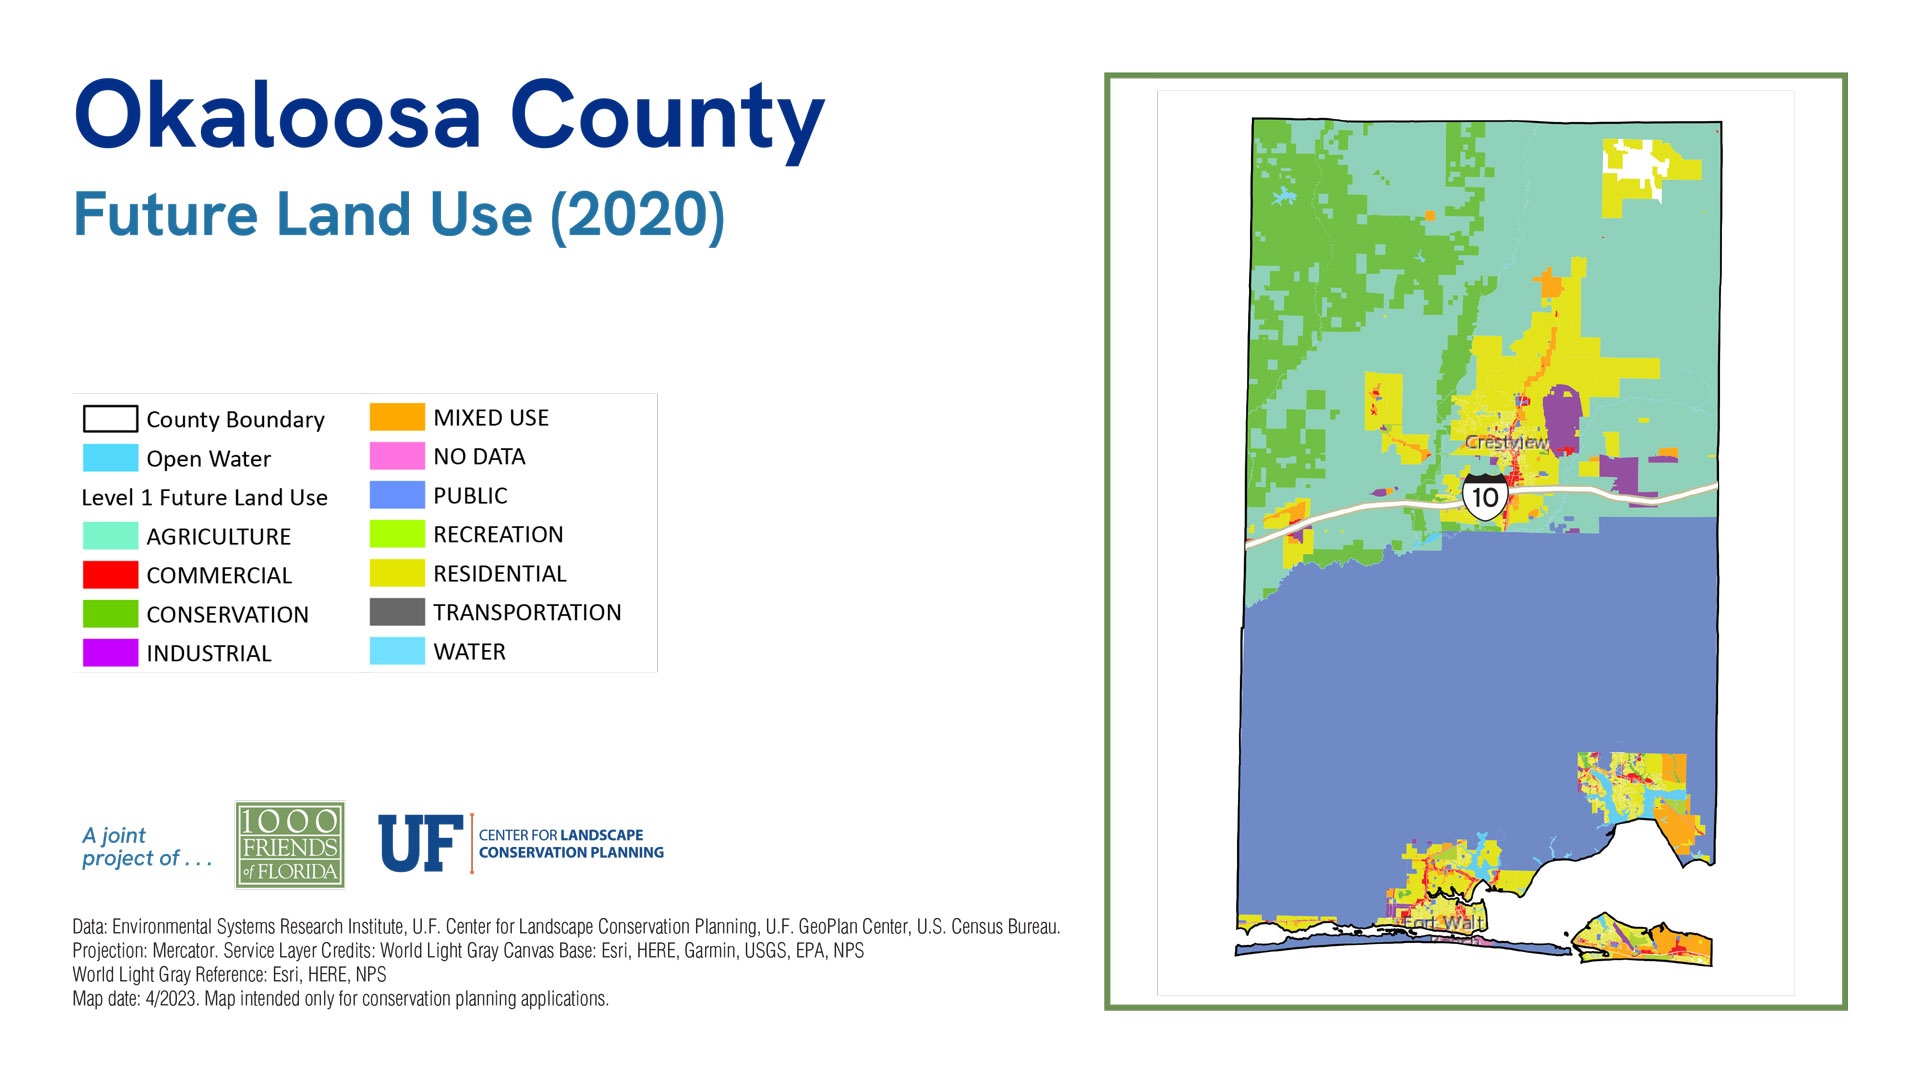
Okaloosa County
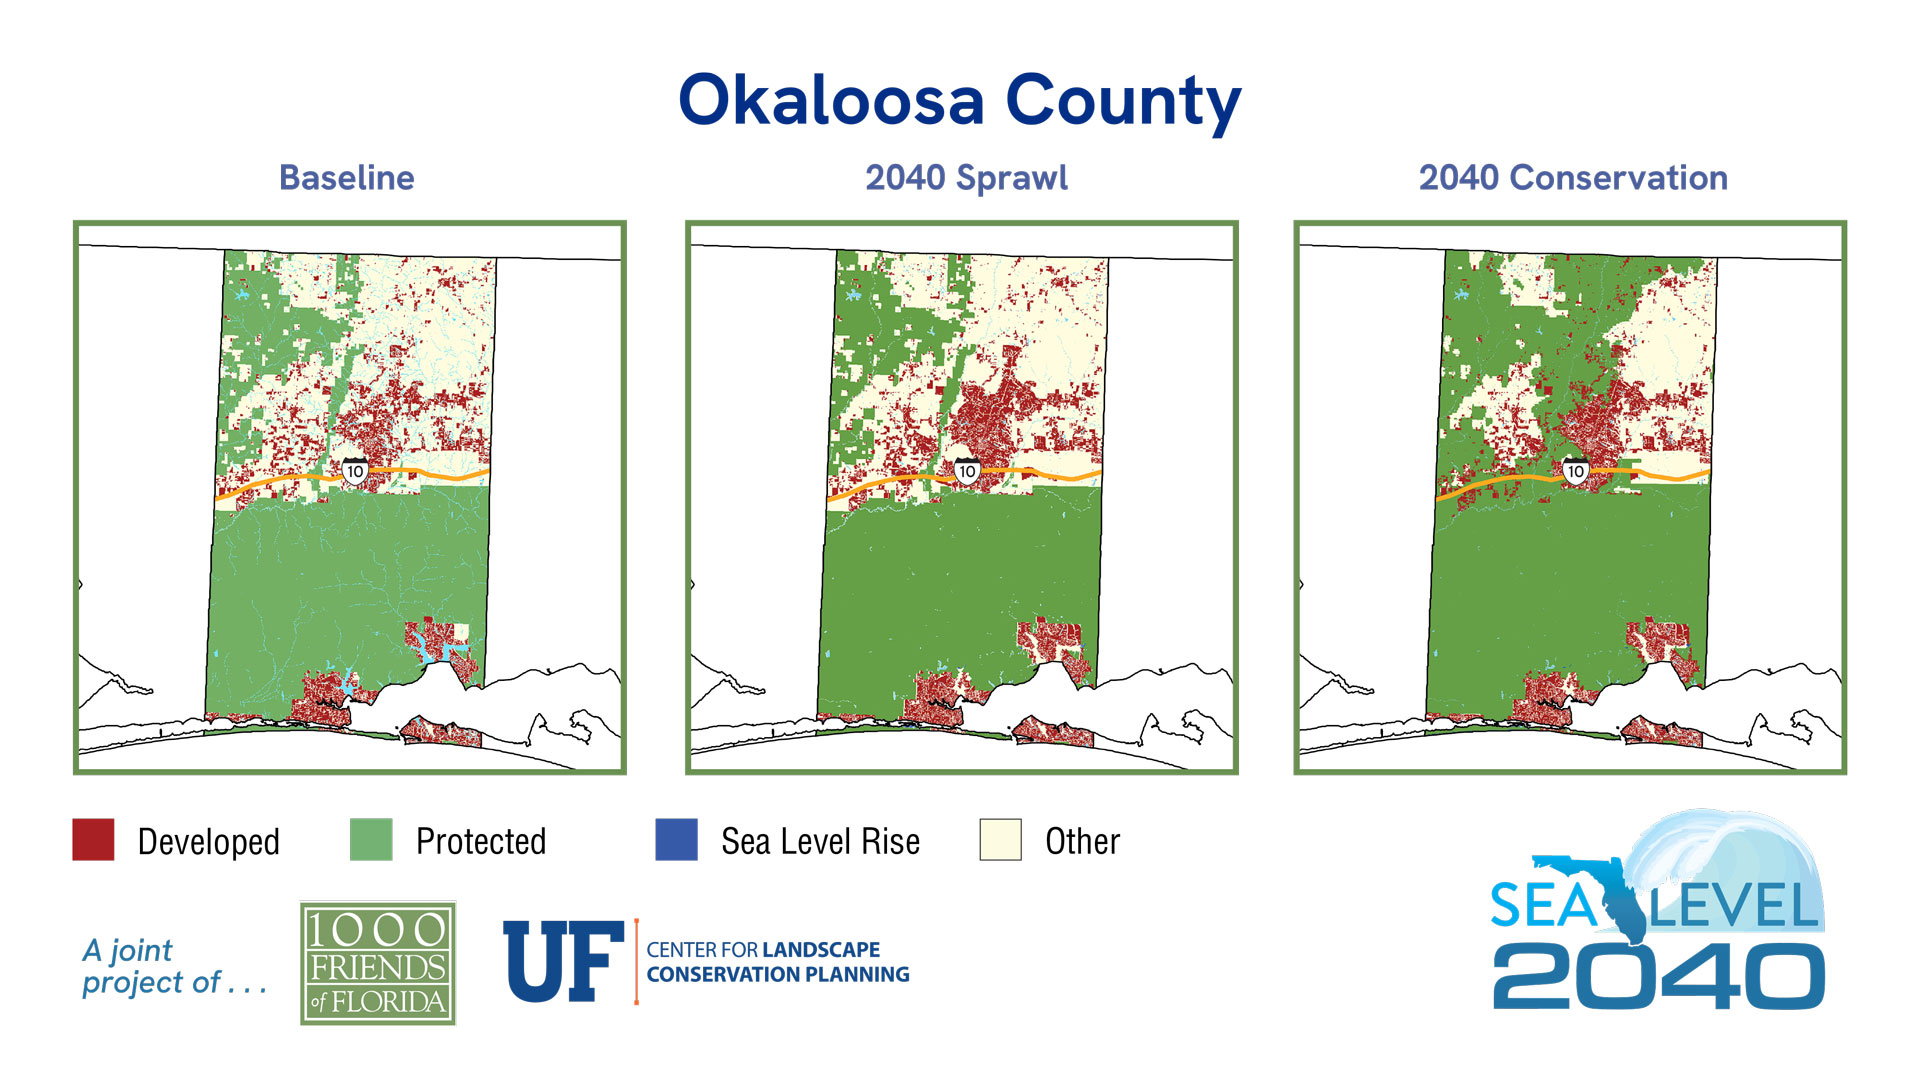
Sea Level 2040:
Baseline
2040 Sprawl
2040 Conservation
| 2019 | % of Total Acreage | Sprawl 2040 | % of Total Acreage | Conservation 2040 | % of Total Acreage | |
|---|---|---|---|---|---|---|
| Developed | 66,563 | 11.03% | 76,608 | 12.69% | 74,197 | 12.29% |
| Protected Natural Land | 316,315 | 52.41% | 315,963 | 52.35% | 374,090 | 61.98% |
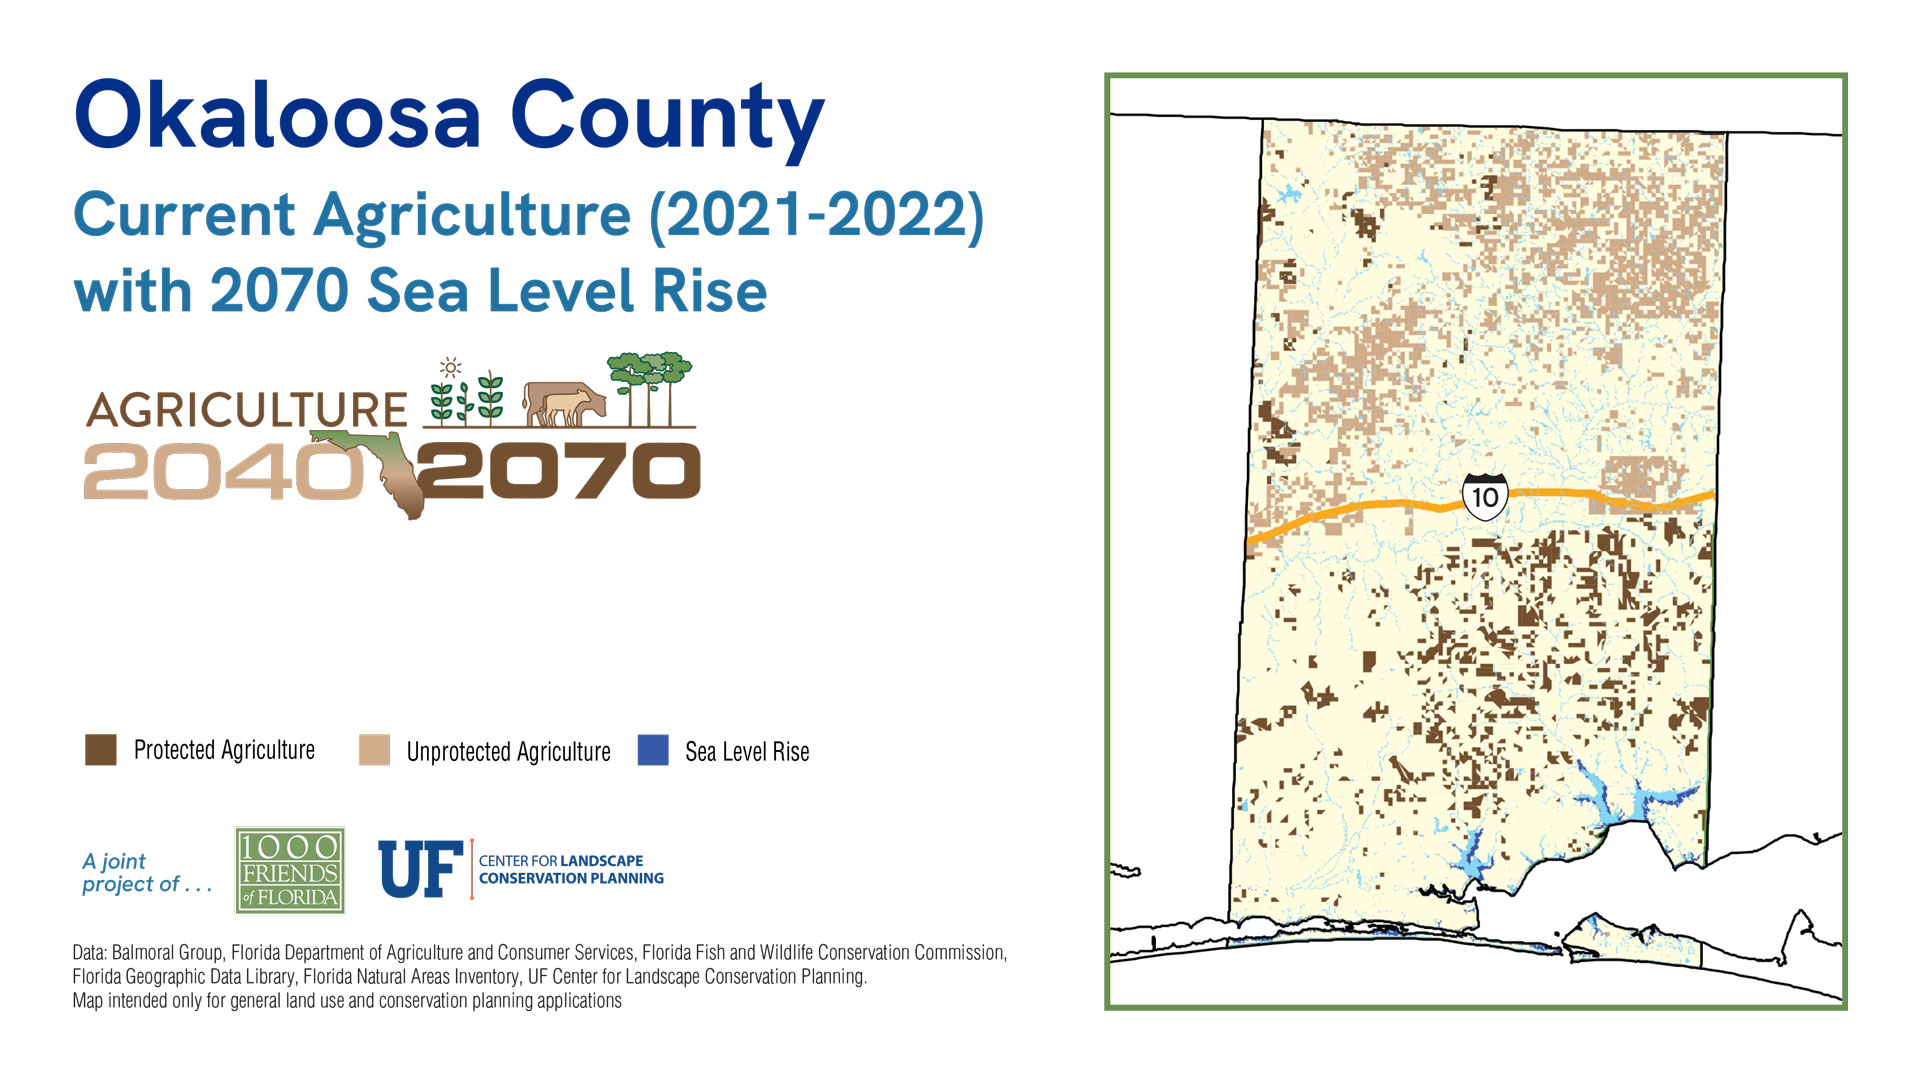
| Protected Agriculture | 385 | 0.06% | 385 | 0.06% | 3,088 | 0.51% |
| Agriculture | 27,842 | 4.61% | 27,162 | 4.50% | 24,590 | 4.07% |
| Other* | 185,166 | 30.68% | 175,625 | 29.10% | 119,779 | 19.85% |
| 2019 Open Water | 7,251 | 1.20% | 7,251 | 1.20% | 7,251 | 1.20% |
| Sea Level Inundation: Protected Lands | 0 | 0.00% | 352 | 0.06% | 353 | 0.06% |
| Sea Level Inundation: All Other Land Uses | 0 | 0.00% | 176 | 0.03% | 174 | 0.03% |
| Total Acreage | 603,522 | 100.00% | 603,522 | 100.00% | 603,522 | 100.00% |
| Total Land Acreage | 596,271 | 98.80% | 595,743 | 98.71% | 595,744 | 98.71% |
| Total Open Water including SLR | 7,251 | 1.20% | 7,779 | 1.29% | 7,778 | 1.29% |
| Total Sea Level Inundation | 0 | 0.00% | 528 | 0.09% | 527 | 0.09% |
Population
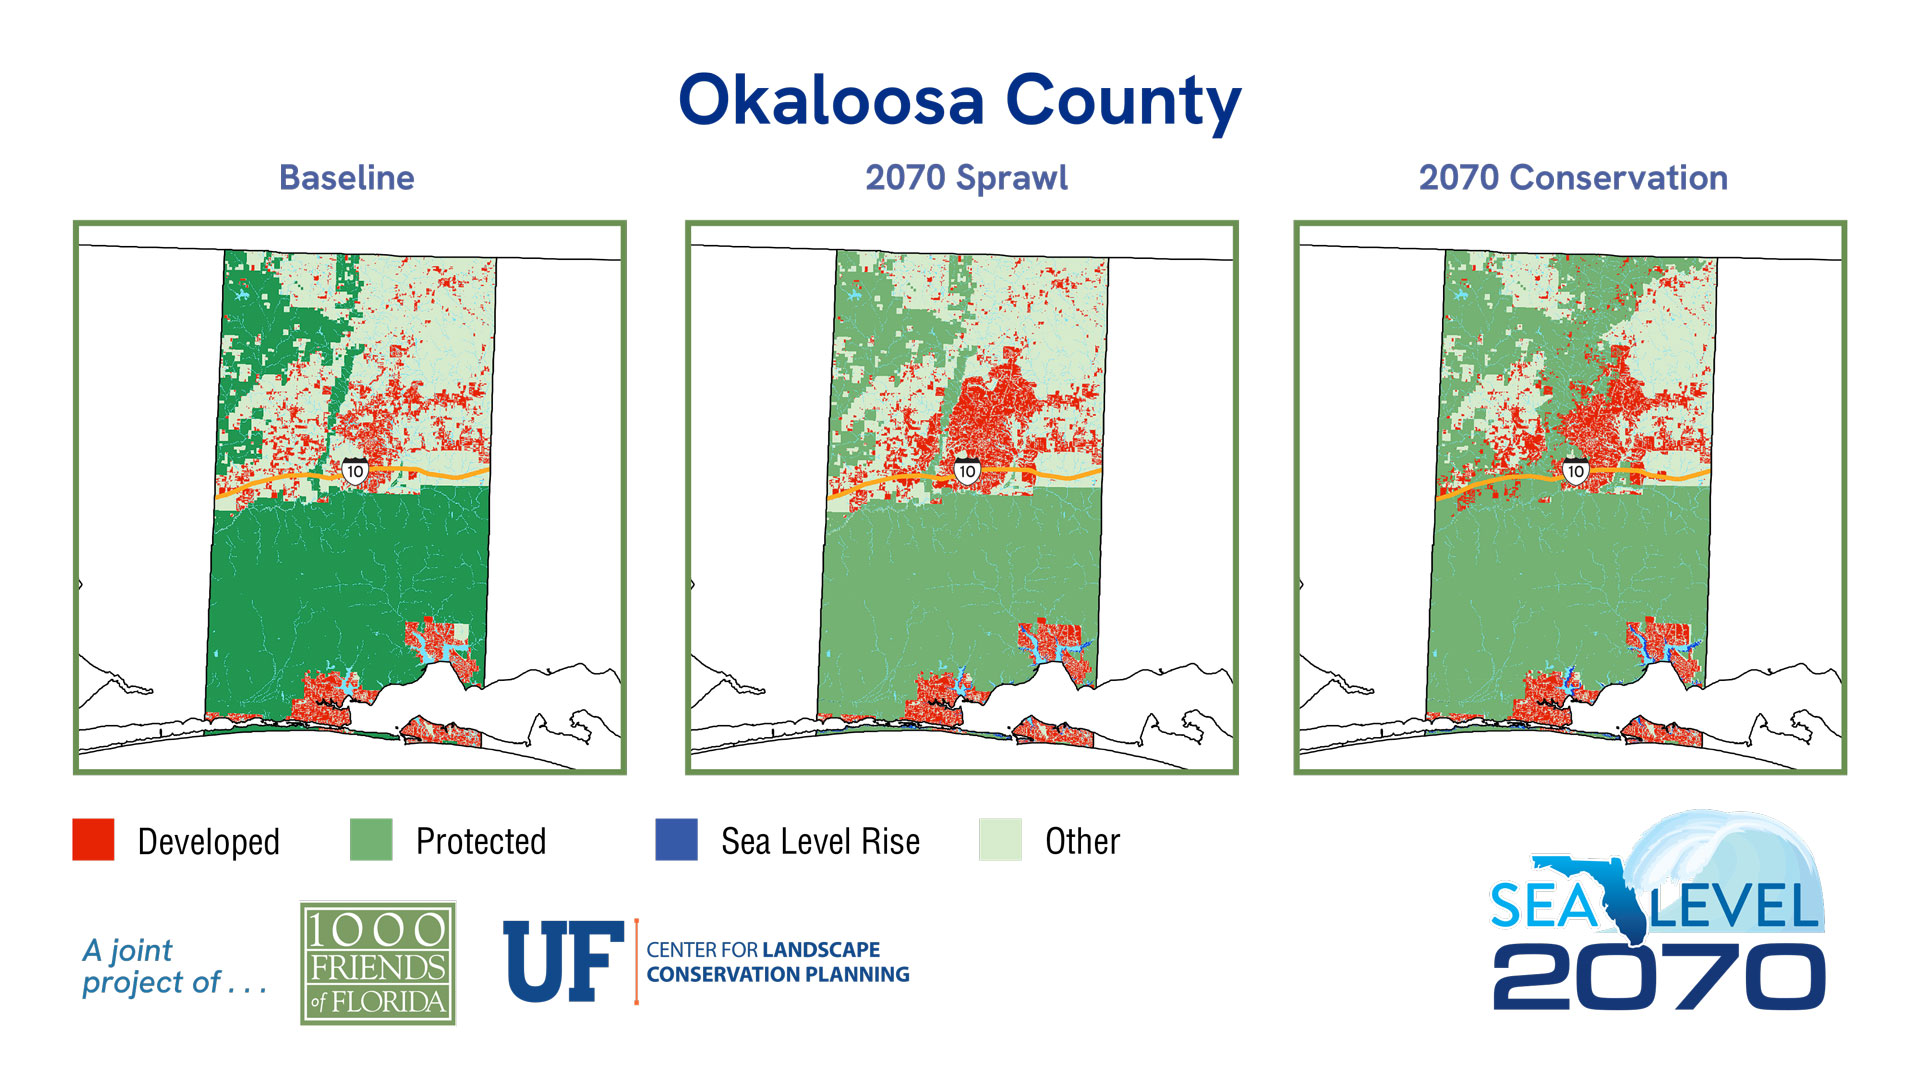
Sea Level 2070:
Baseline
2070 Sprawl
2070 Conservation
| 2019 | % of Total Acreage | Sprawl 2070 | % of Total Acreage | Conservation 2070 | % of Total Acreage | |
|---|---|---|---|---|---|---|
| Developed | 66,563 | 11.03% | 84,673 | 14.03% | 78,752 | 13.05% |
| Protected Natural Land | 316,315 | 52.41% | 314,852 | 52.17% | 372,948 | 61.80% |
| Protected Agriculture | 385 | 0.06% | 385 | 0.06% | 3,004 | 0.50% |
| Agriculture | 27,842 | 4.61% | 26,383 | 4.37% | 23,639 | 3.92% |
| Other* | 185,166 | 30.68% | 168,229 | 27.87% | 116,179 | 19.25% |
| 2019 Open Water | 7,251 | 1.20% | 7,251 | 1.20% | 7,251 | 1.20% |
| Sea Level Inundation: Protected Lands | 0 | 0.00% | 899 | 0.15% | 920 | 0.15% |
| Sea Level Inundation: All Other Land Uses | 0 | 0.00% | 850 | 0.14% | 830 | 0.14% |
| Total Acreage | 603,522 | 100.00% | 603,522 | 100.00% | 603,522 | 100.00% |
| Total Land Acreage | 596,271 | 98.80% | 594,522 | 98.51% | 594,522 | 98.51% |
| Total Open Water including SLR | 7,251 | 1.20% | 9,000 | 1.49% | 9,001 | 1.49% |
| Total Sea Level Inundation | 0 | 0.00% | 1,749 | 0.29% | 1,750 | 0.29% |
