County Maps
Liberty County
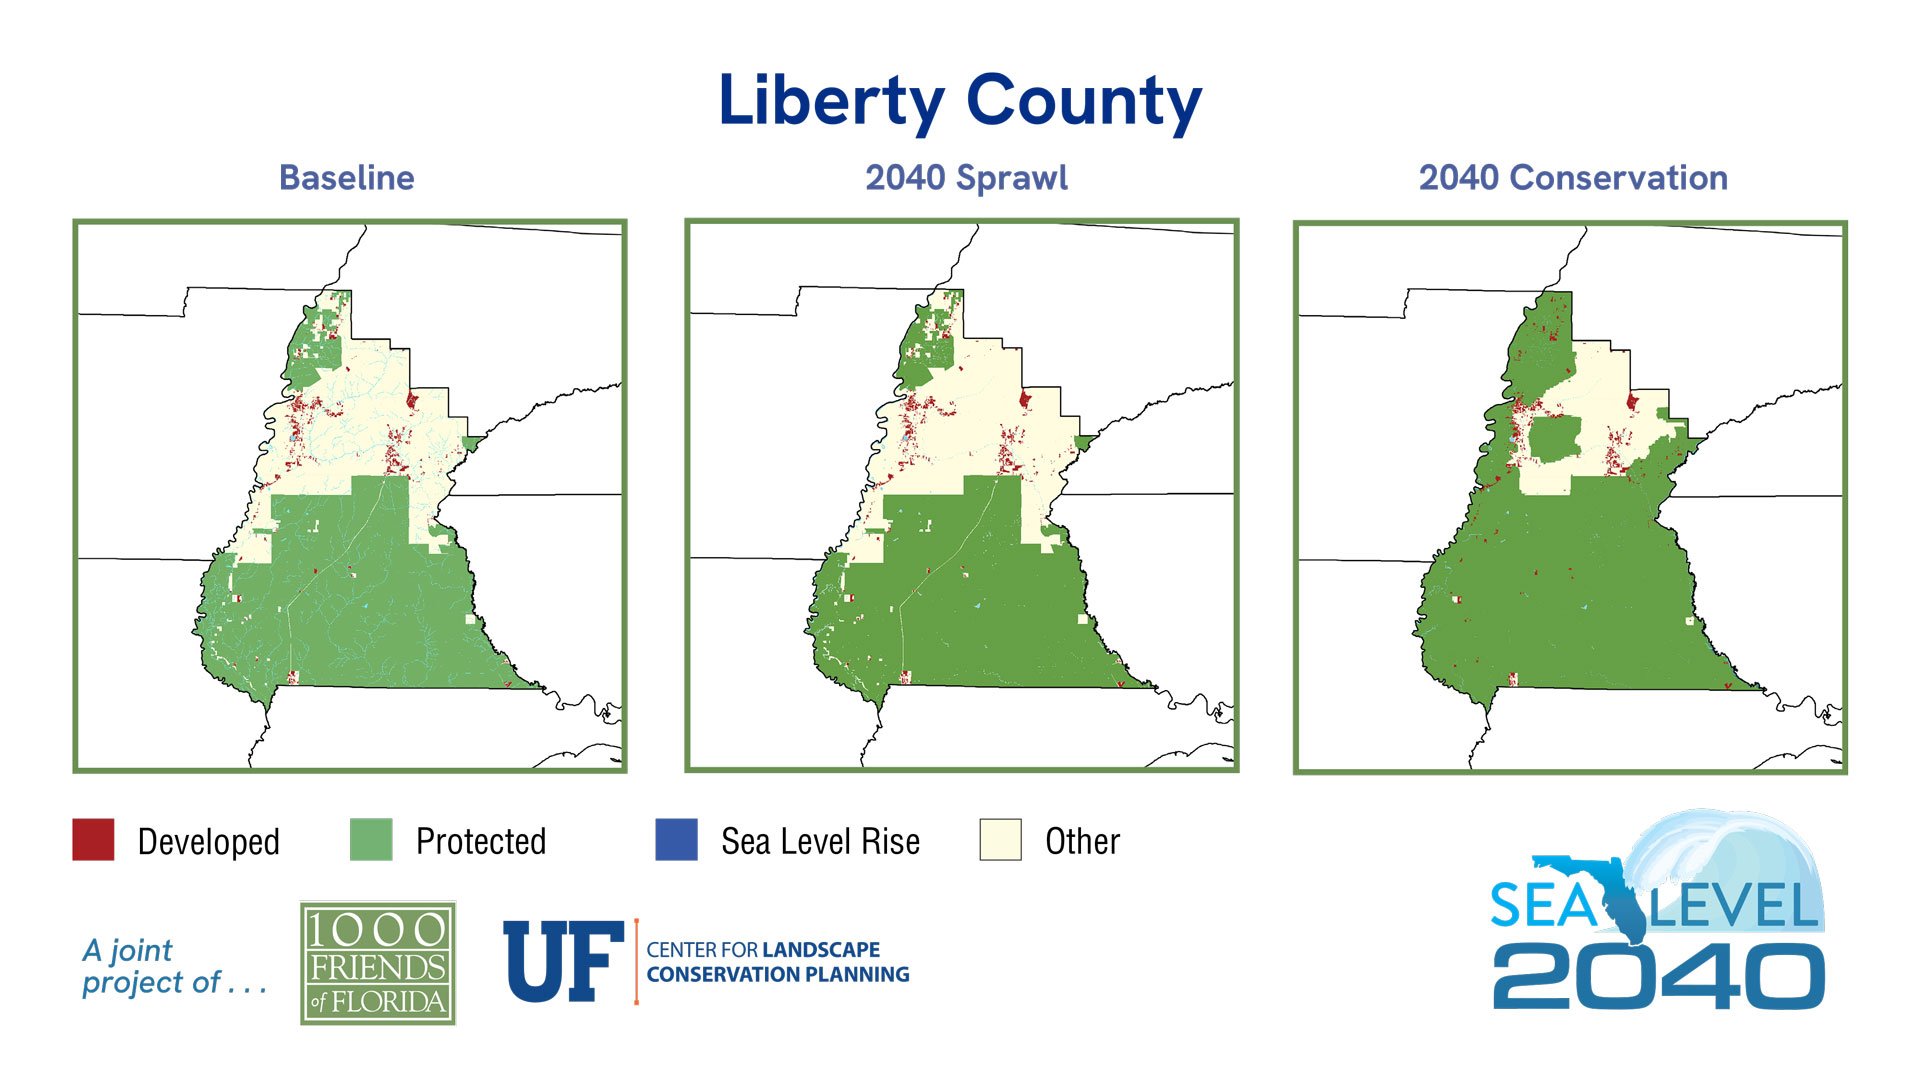
Sea Level 2040:
Baseline
2040 Sprawl
2040 Conservation
| 2019 | % of Total Acreage | Sprawl 2040 | % of Total Acreage | Conservation 2040 | % of Total Acreage | |
|---|---|---|---|---|---|---|
| Developed | 8,935 | 1.66% | 9,143 | 1.69% | 9,143 | 1.69% |
| Protected Natural Land | 339,077 | 62.84% | 339,067 | 62.84% | 427,432 | 79.21% |
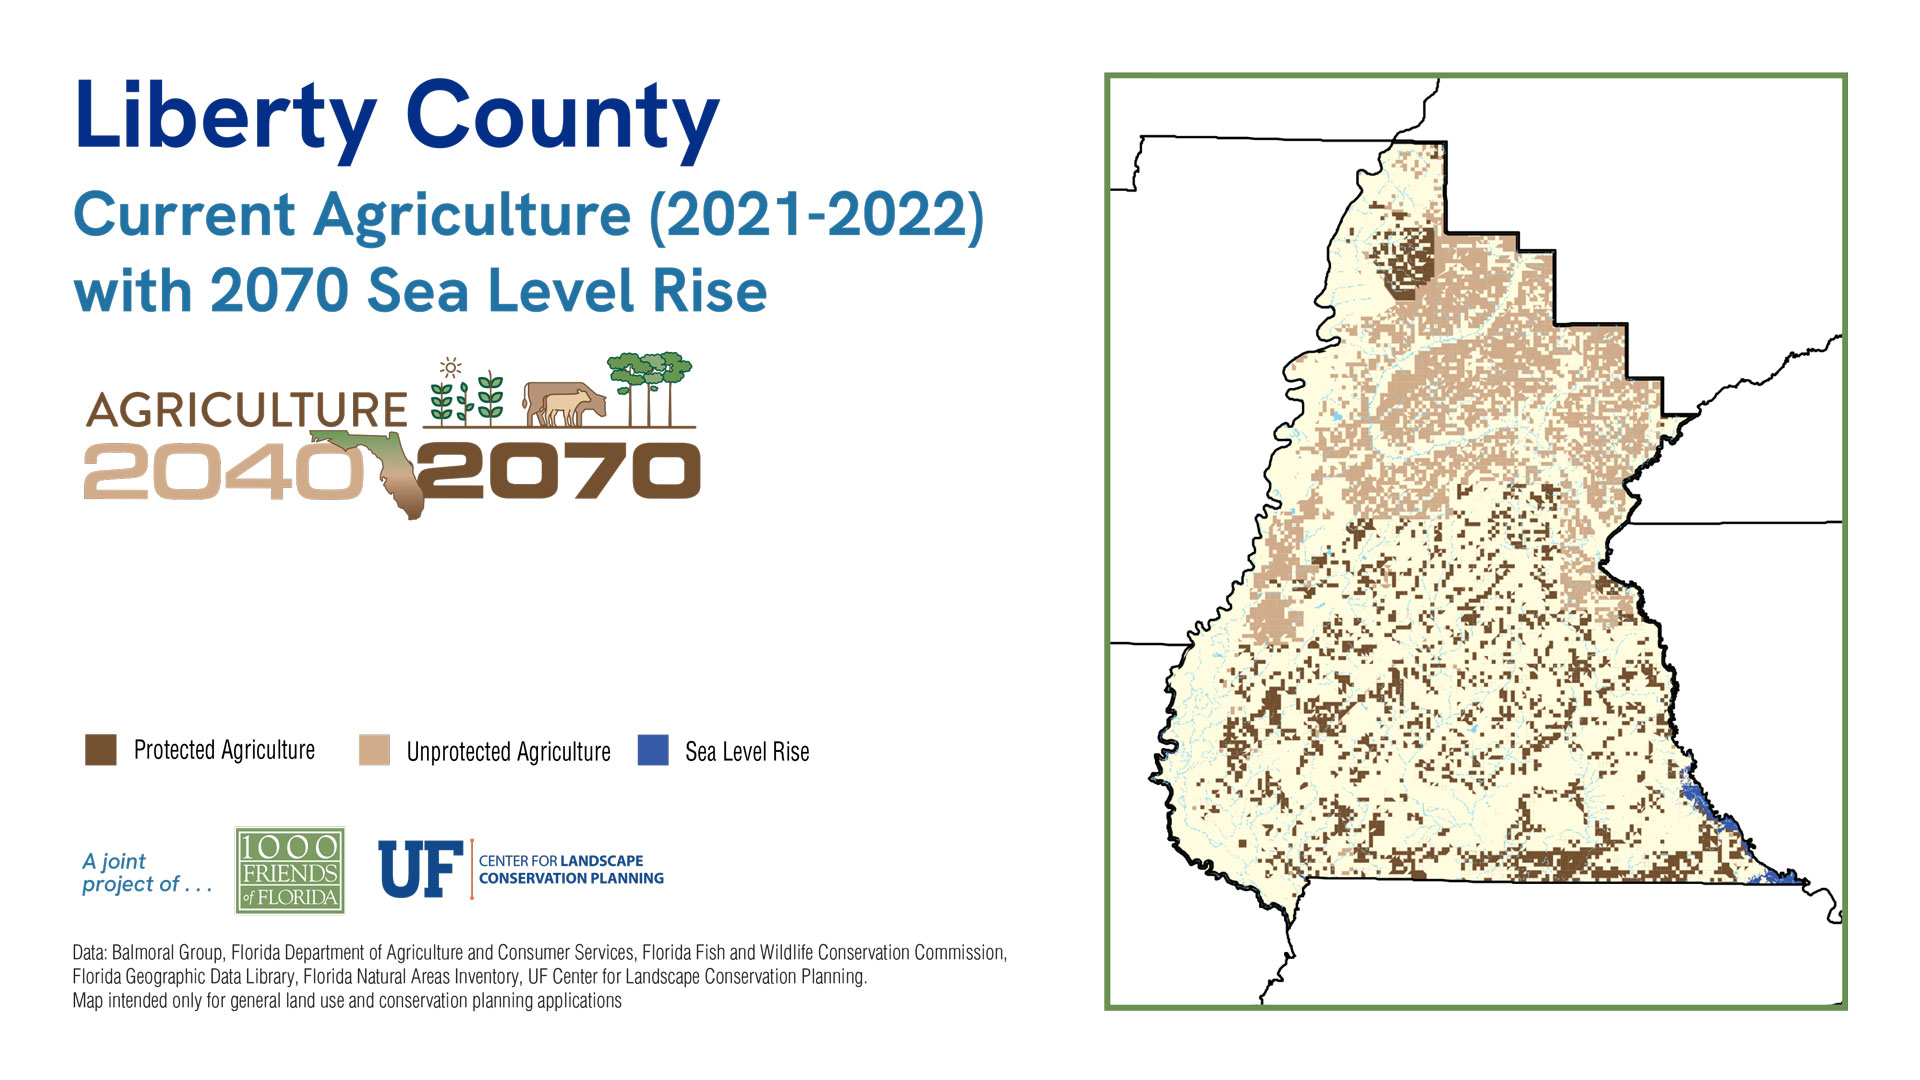
| Protected Agriculture | 108 | 0.02% | 108 | 0.02% | 1,921 | 0.36% |
| Agriculture | 4,751 | 0.88% | 4,751 | 0.88% | 2,938 | 0.54% |
| Other* | 181,240 | 33.59% | 181,032 | 33.55% | 92,666 | 17.17% |
| 2019 Open Water | 5,490 | 1.02% | 5,490 | 1.02% | 5,490 | 1.02% |
| Sea Level Inundation: Protected Lands | 0 | 0.00% | 10 | 0.00% | 11 | 0.00% |
| Sea Level Inundation: All Other Land Uses | 0 | 0.00% | 0 | 0.00% | 0 | 0.00% |
| Total Acreage | 539,601 | 100.00% | 539,601 | 100.00% | 539,601 | 100.00% |
| Total Land Acreage | 534,111 | 98.98% | 534,101 | 98.98% | 534,100 | 98.98% |
| Total Open Water including SLR | 5,490 | 1.02% | 5,500 | 1.02% | 5,501 | 1.02% |
| Total Sea Level Inundation | 0 | 0.00% | 10 | 0.00% | 11 | 0.00% |
Population
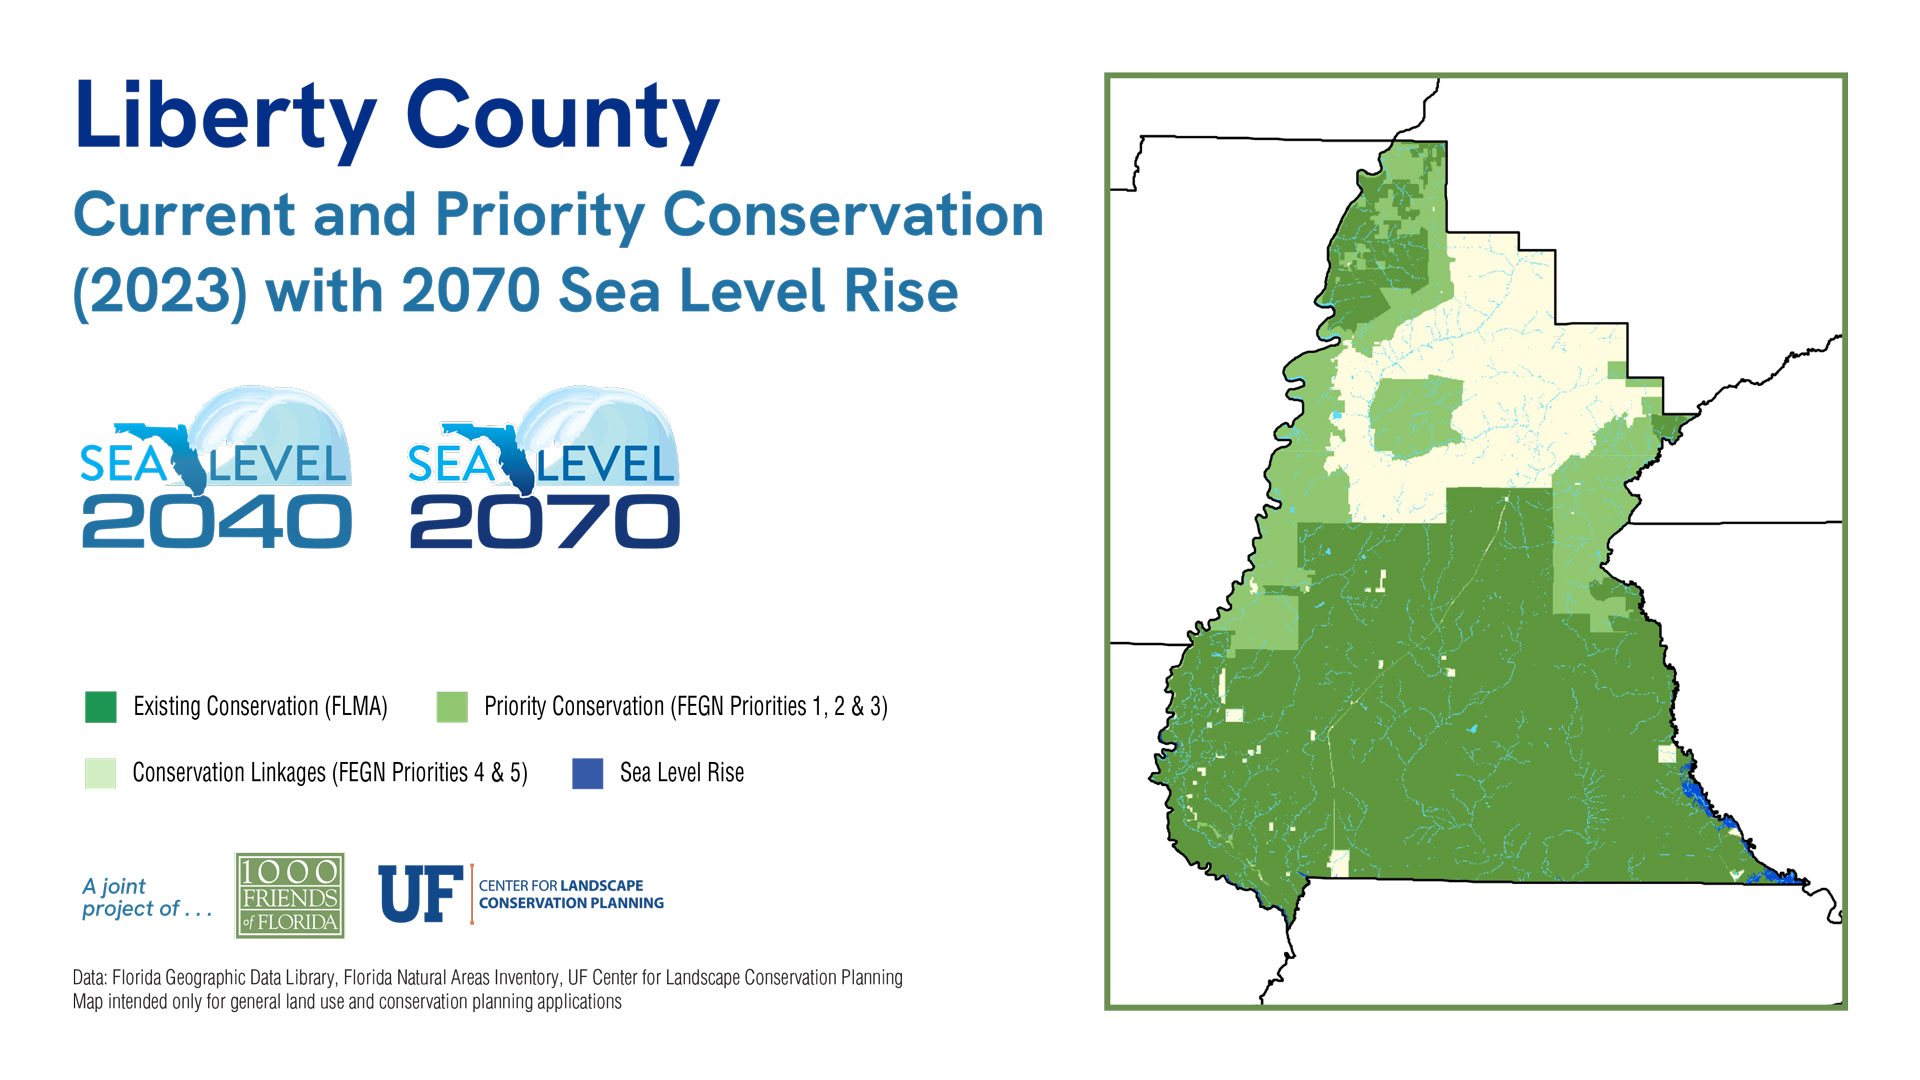
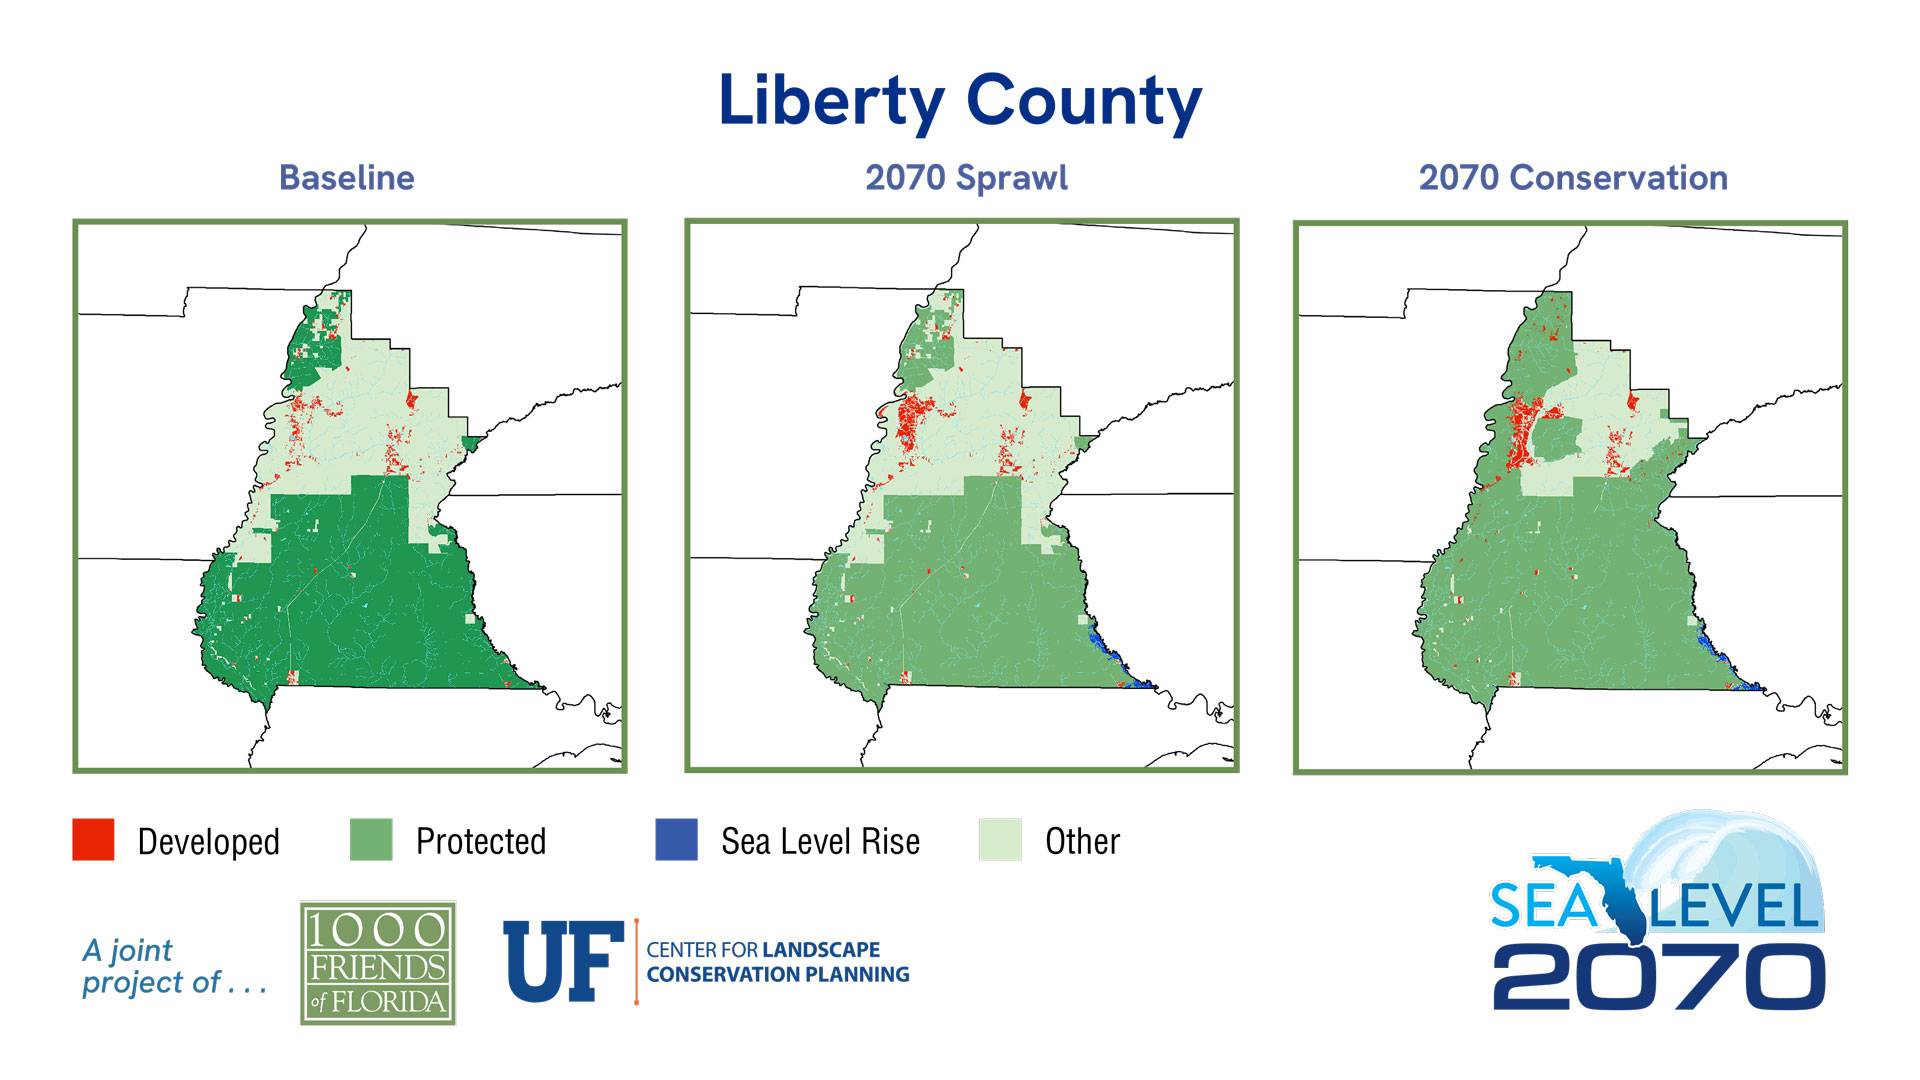
Sea Level 2070:
Baseline
2070 Sprawl
2070 Conservation
| 2019 | % of Total Acreage | Sprawl 2070 | % of Total Acreage | Conservation 2070 | % of Total Acreage | |
|---|---|---|---|---|---|---|
| Developed | 8,935 | 1.66% | 12,469 | 2.31% | 13,856 | 2.57% |
| Protected Natural Land | 339,077 | 62.84% | 336,391 | 62.34% | 424,714 | 78.71% |
| Protected Agriculture | 108 | 0.02% | 108 | 0.02% | 1,921 | 0.36% |
| Agriculture | 4,751 | 0.88% | 4,082 | 0.76% | 1,345 | 0.25% |
| Other* | 181,240 | 33.59% | 178,374 | 33.06% | 89,588 | 16.60% |
| 2019 Open Water | 5,490 | 1.02% | 5,490 | 1.02% | 5,490 | 1.02% |
| Sea Level Inundation: Protected Lands | 0 | 0.00% | 2,518 | 0.47% | 2,553 | 0.47% |
| Sea Level Inundation: All Other Land Uses | 0 | 0.00% | 169 | 0.03% | 134 | 0.02% |
| Total Acreage | 539,601 | 100.00% | 539,601 | 100.00% | 539,601 | 100.00% |
| Total Land Acreage | 534,111 | 98.98% | 531,424 | 98.48% | 531,424 | 98.48% |
| Total Open Water including SLR | 5,490 | 1.02% | 8,177 | 1.52% | 8,177 | 1.52% |
| Total Sea Level Inundation | 0 | 0.00% | 2,687 | 0.50% | 2,687 | 0.50% |
