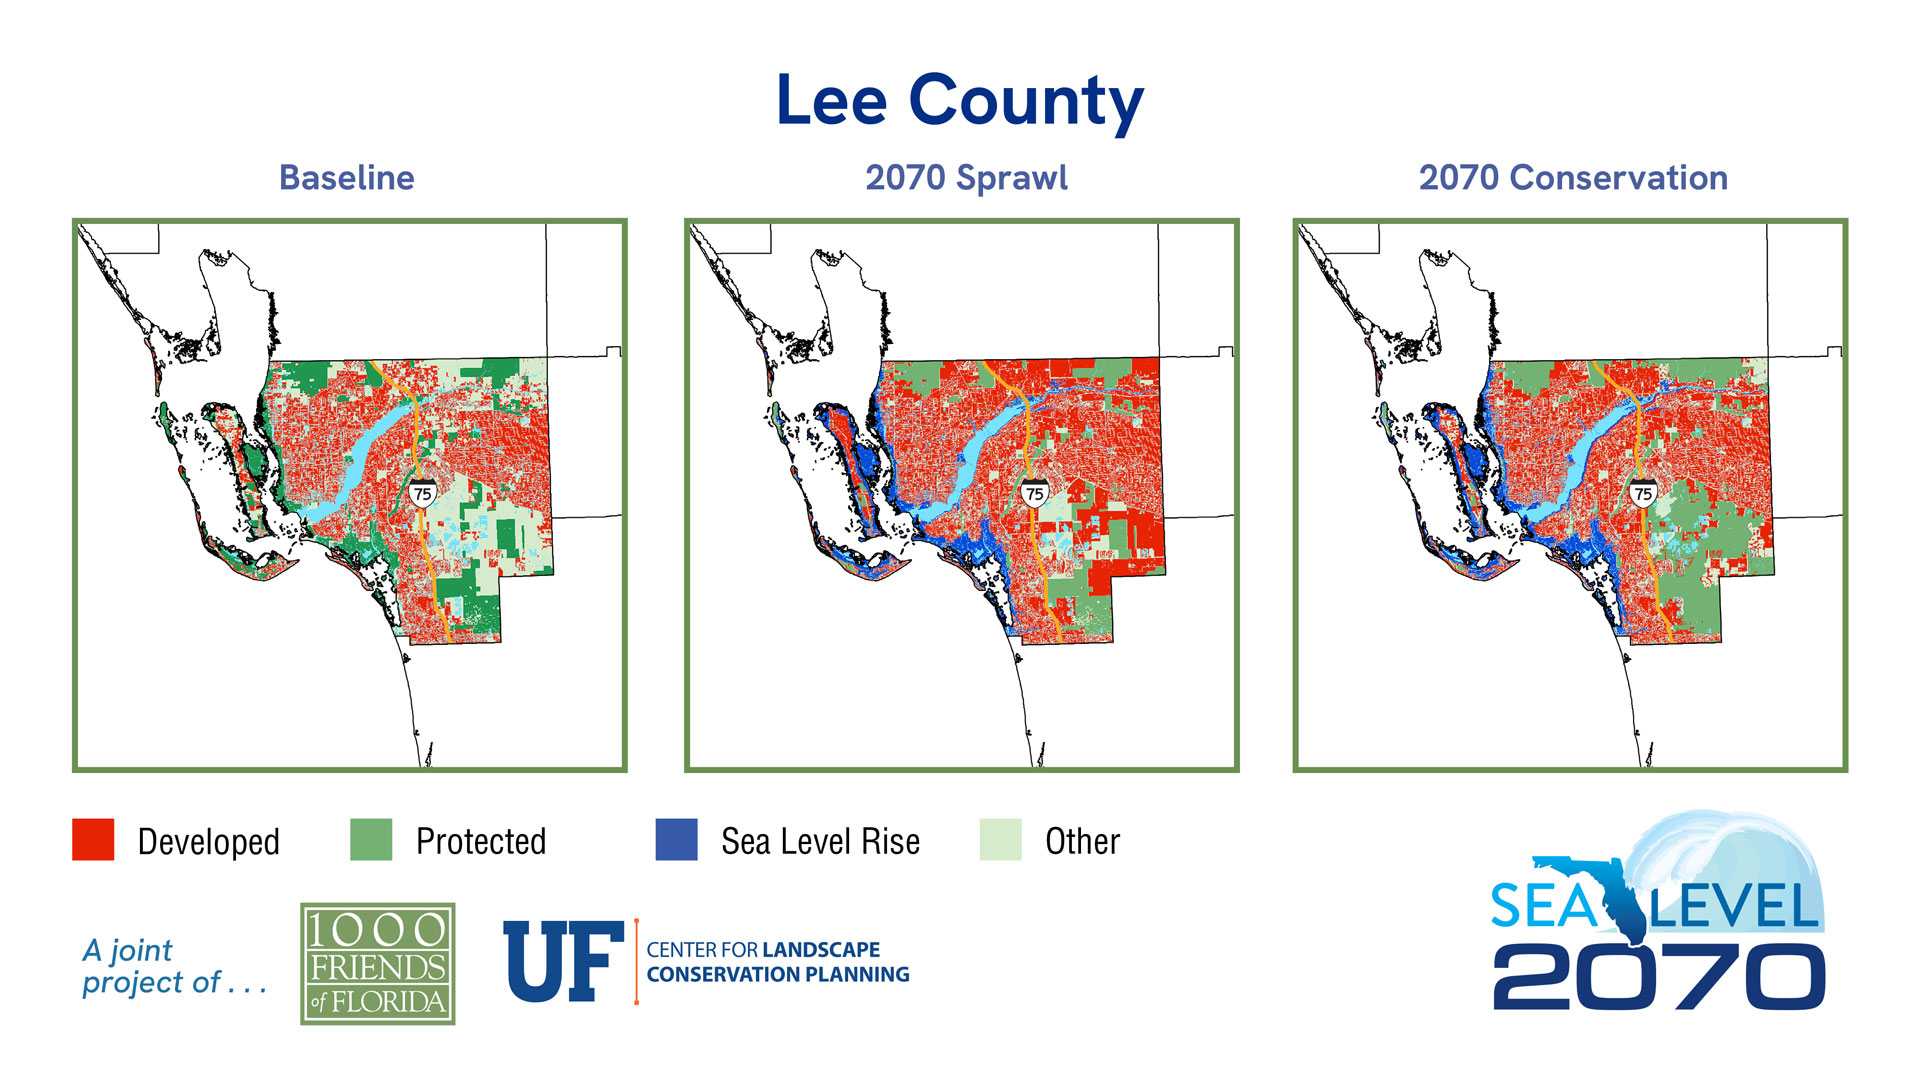
County Maps
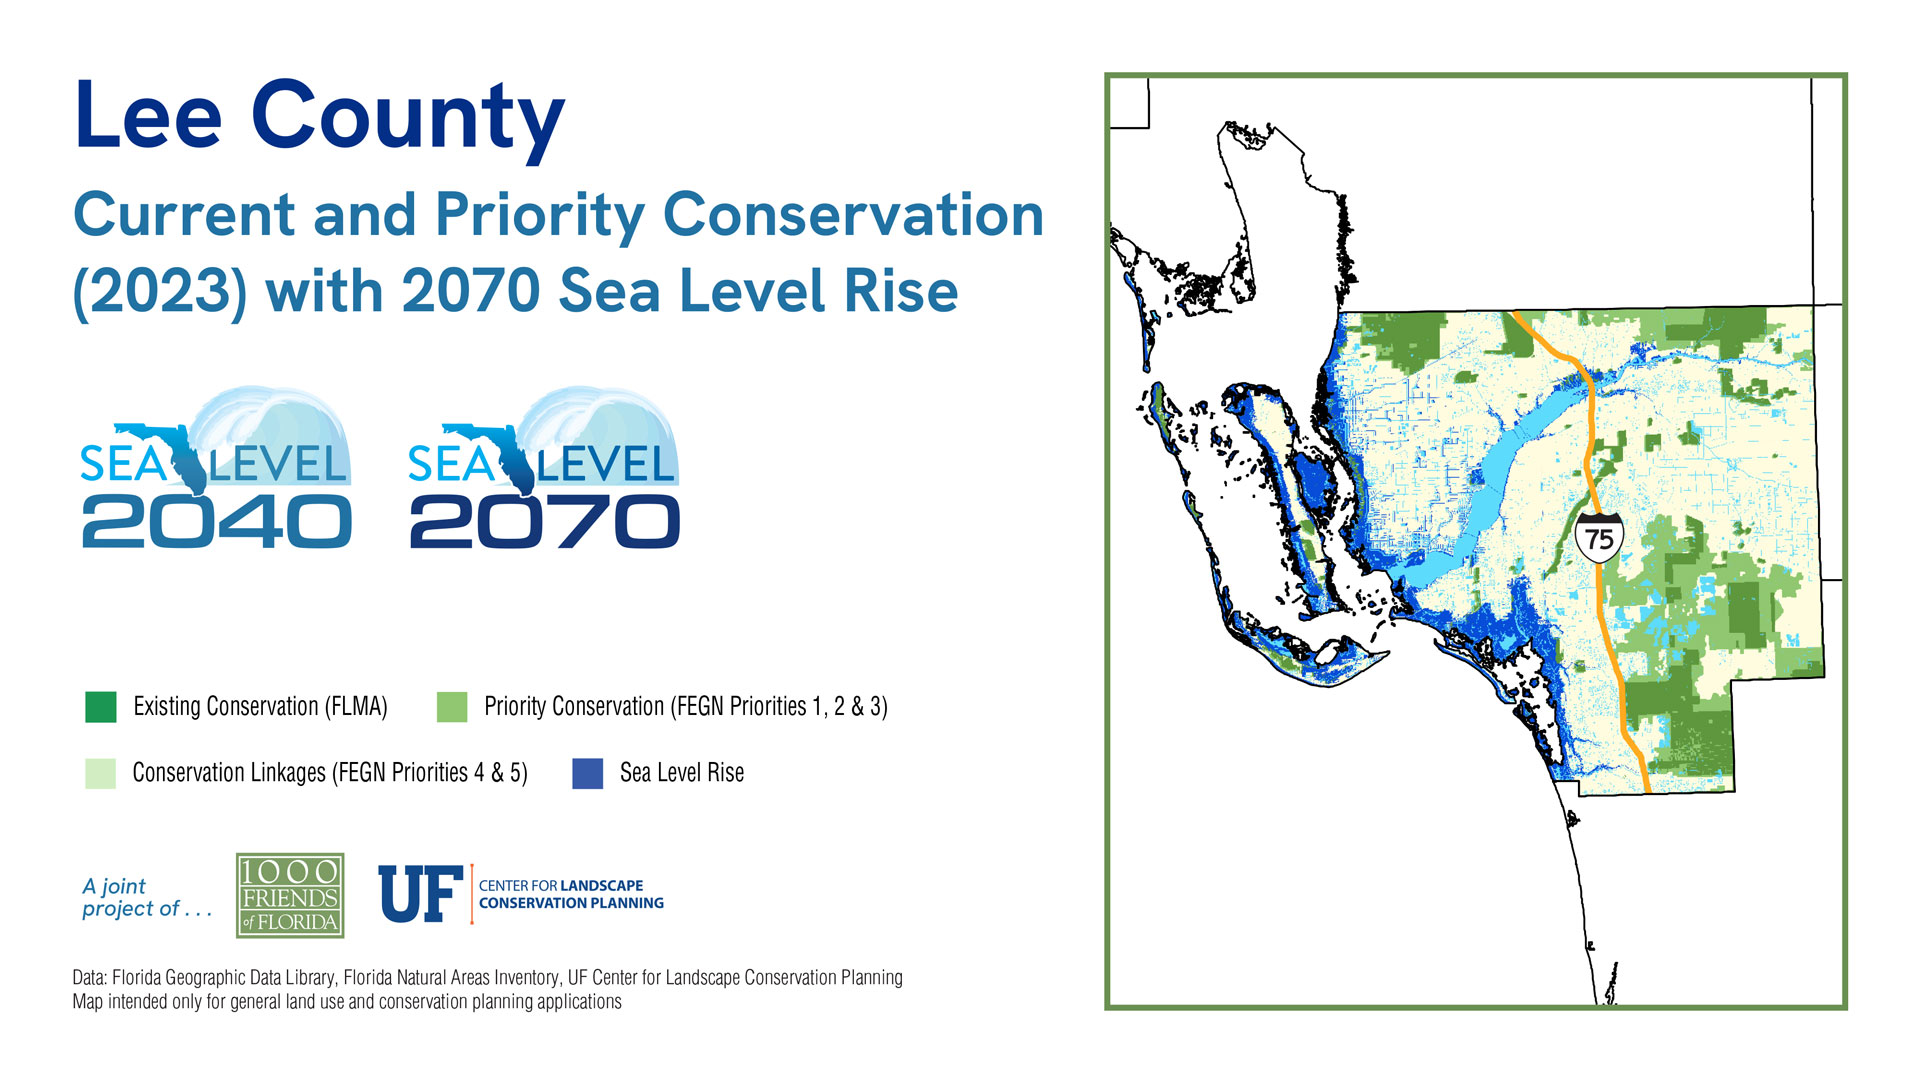
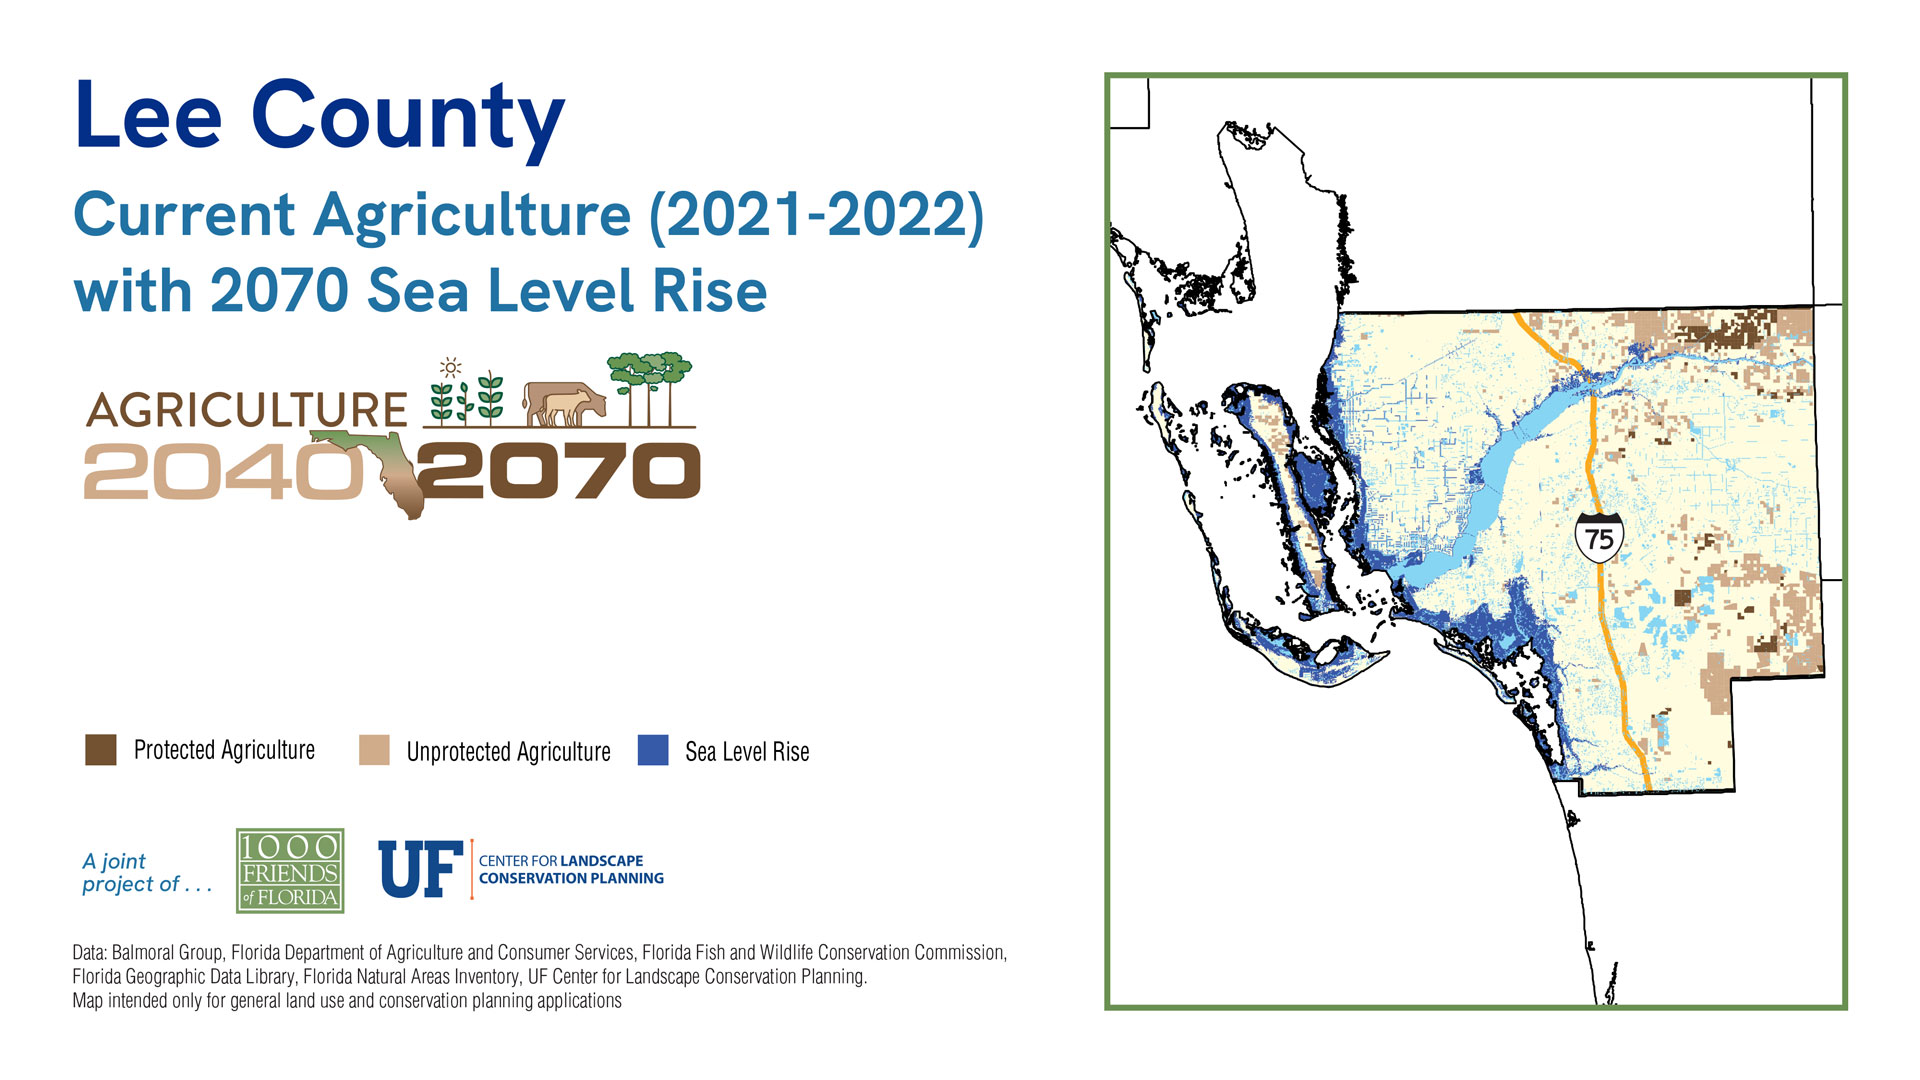
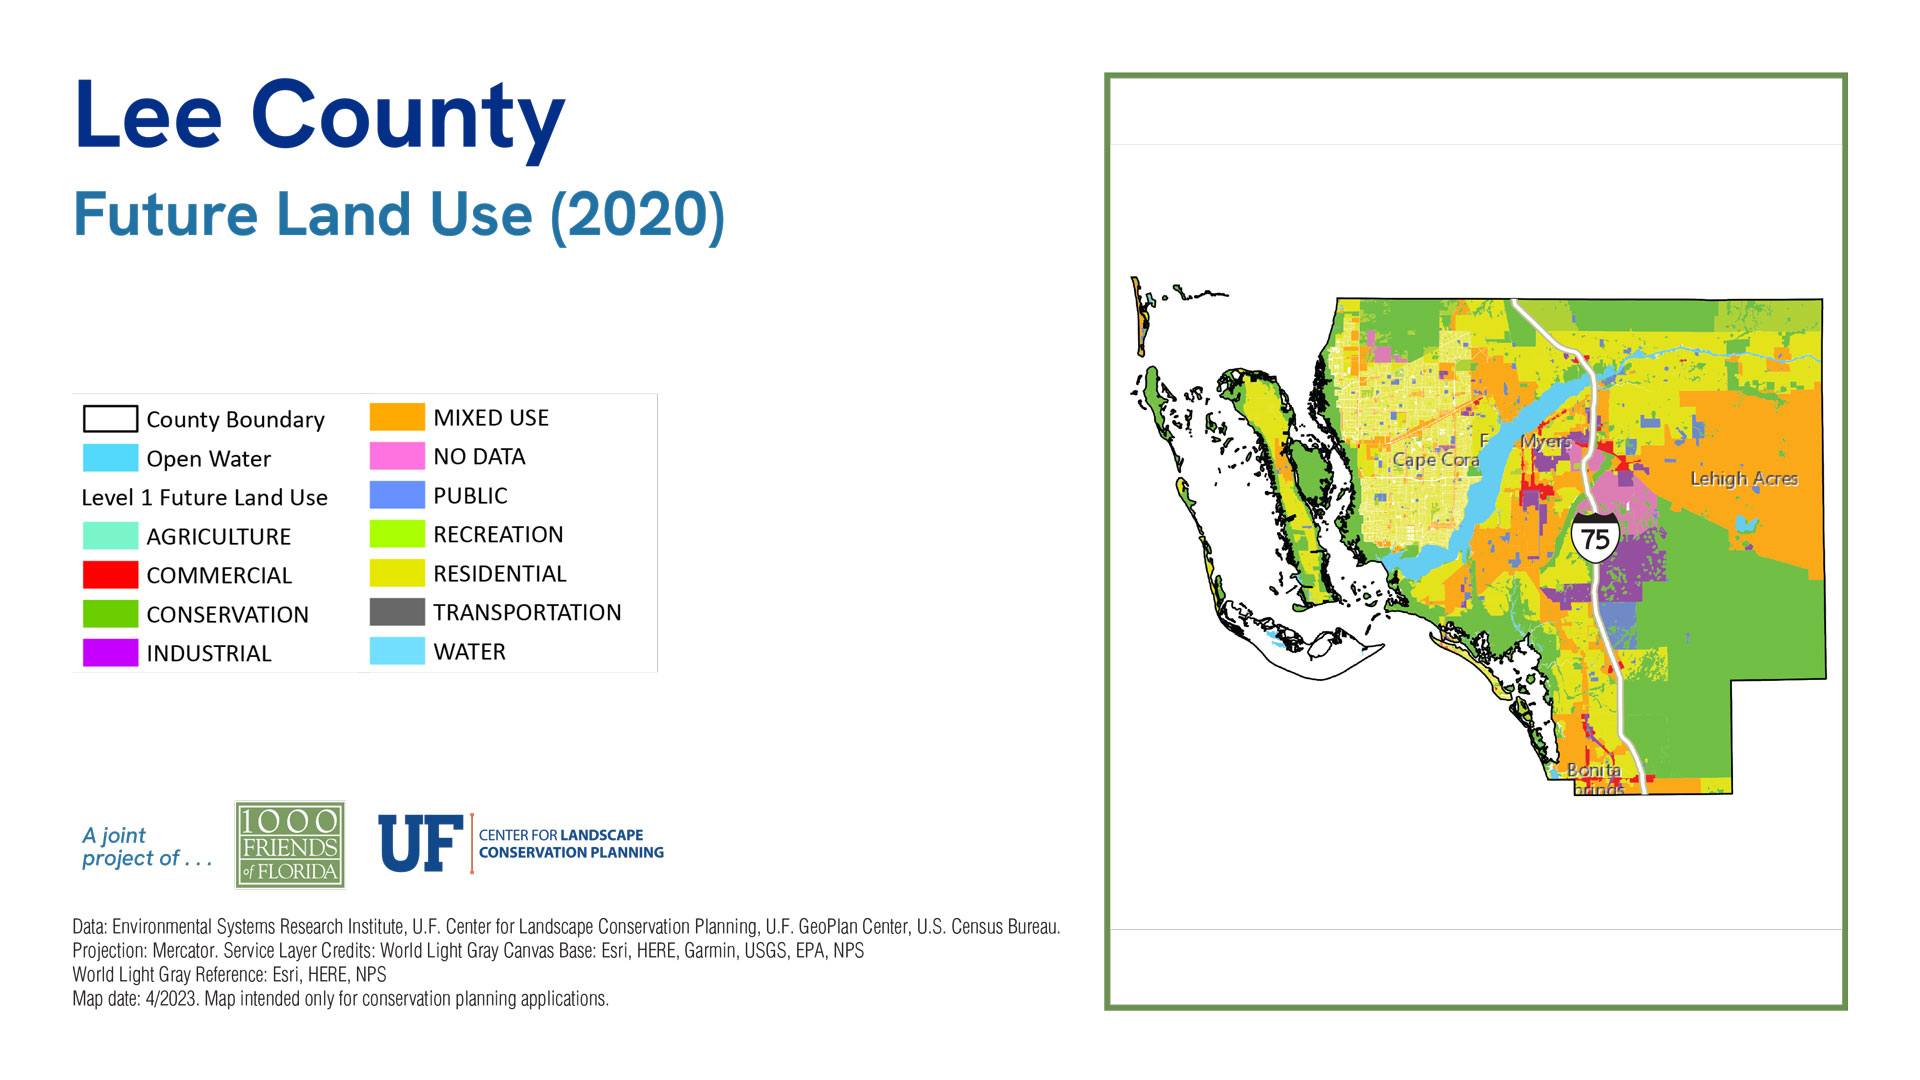
Lee County
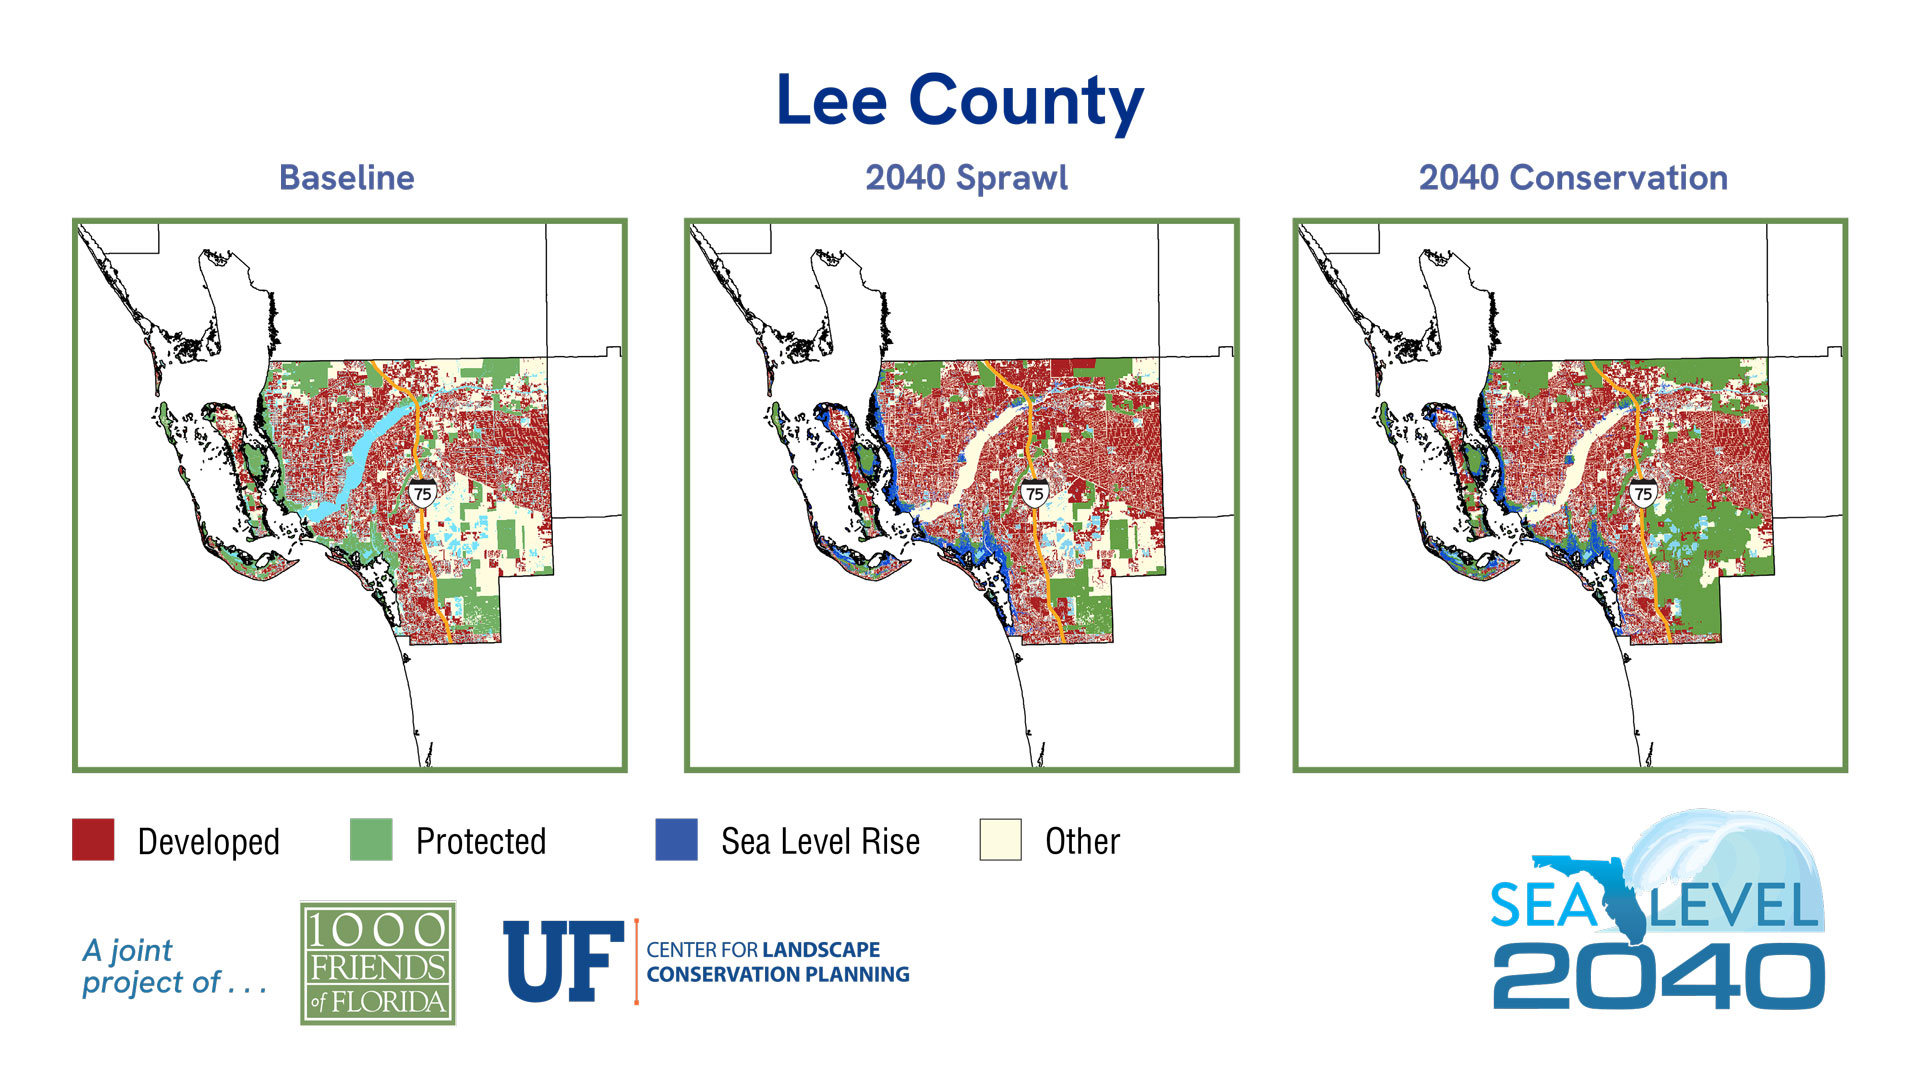
Sea Level 2040:
Baseline
2040 Sprawl
2040 Conservation
Baseline
2040 Sprawl
2040 Conservation
| 2019 | % of Total Acreage | Sprawl 2040 | % of Total Acreage | Conservation 2040 | % of Total Acreage | |
|---|---|---|---|---|---|---|
| Developed | 190,731 | 35.46% | 212,324 | 39.48% | 202,498 | 37.65% |
| Protected Natural Land | 89,909 | 16.72% | 66,580 | 12.38% | 96,122 | 17.87% |
| Protected Agriculture | 8,588 | 1.60% | 8,584 | 1.60% | 28,386 | 5.28% |
| Agriculture | 49,962 | 9.29% | 40,539 | 7.54% | 26,381 | 4.91% |
| Other* | 173,227 | 32.21% | 150,243 | 27.94% | 124,884 | 23.22% |
| 2019 Open Water | 25,386 | 4.72% | 25,386 | 4.72% | 25,386 | 4.72% |
| Sea Level Inundation: Protected Lands | 0 | 0.00% | 23,333 | 4.34% | 23,504 | 4.37% |
| Sea Level Inundation: All Other Land Uses | 0 | 0.00% | 10,814 | 2.01% | 10,642 | 1.98% |
| Total Acreage | 537,803 | 100.00% | 537,803 | 100.00% | 537,803 | 100.00% |
| Total Land Acreage | 512,417 | 95.28% | 478,270 | 88.93% | 478,271 | 88.93% |
| Total Open Water including SLR | 25,386 | 4.72% | 59,533 | 11.07% | 59,532 | 11.07% |
| Total Sea Level Inundation | 0 | 0.00% | 34,147 | 6.35% | 34,146 | 6.35% |
Population
Sea Level 2070:
Baseline
2070 Sprawl
2070 Conservation
| 2019 | % of Total Acreage | Sprawl 2070 | % of Total Acreage | Conservation 2070 | % of Total Acreage | |
|---|---|---|---|---|---|---|
| Developed | 190,731 | 35.46% | 265,050 | 49.28% | 219,690 | 40.85% |
| Protected Natural Land | 89,909 | 16.72% | 55,258 | 10.27% | 84,717 | 15.75% |
| Protected Agriculture | 8,588 | 1.60% | 8,538 | 1.59% | 26,965 | 5.01% |
| Agriculture | 49,962 | 9.29% | 5,260 | 0.98% | 15,289 | 2.84% |
| Other* | 173,227 | 32.21% | 129,200 | 24.02% | 116,645 | 21.69% |
| 2019 Open Water | 25,386 | 4.72% | 25,386 | 4.72% | 25,386 | 4.72% |
| Sea Level Inundation: Protected Lands | 0 | 0.00% | 31,484 | 5.85% | 31,691 | 5.89% |
| Sea Level Inundation: All Other Land Uses | 0 | 0.00% | 17,627 | 3.28% | 17,420 | 3.24% |
| Total Acreage | 537,803 | 100.00% | 537,803 | 100.00% | 537,803 | 100.00% |
| Total Land Acreage | 512,417 | 95.28% | 463,306 | 86.15% | 463,306 | 86.15% |
| Total Open Water including SLR | 25,386 | 4.72% | 74,497 | 13.85% | 74,497 | 13.85% |
| Total Sea Level Inundation | 0 | 0.00% | 49,111 | 9.13% | 49,111 | 9.13% |
