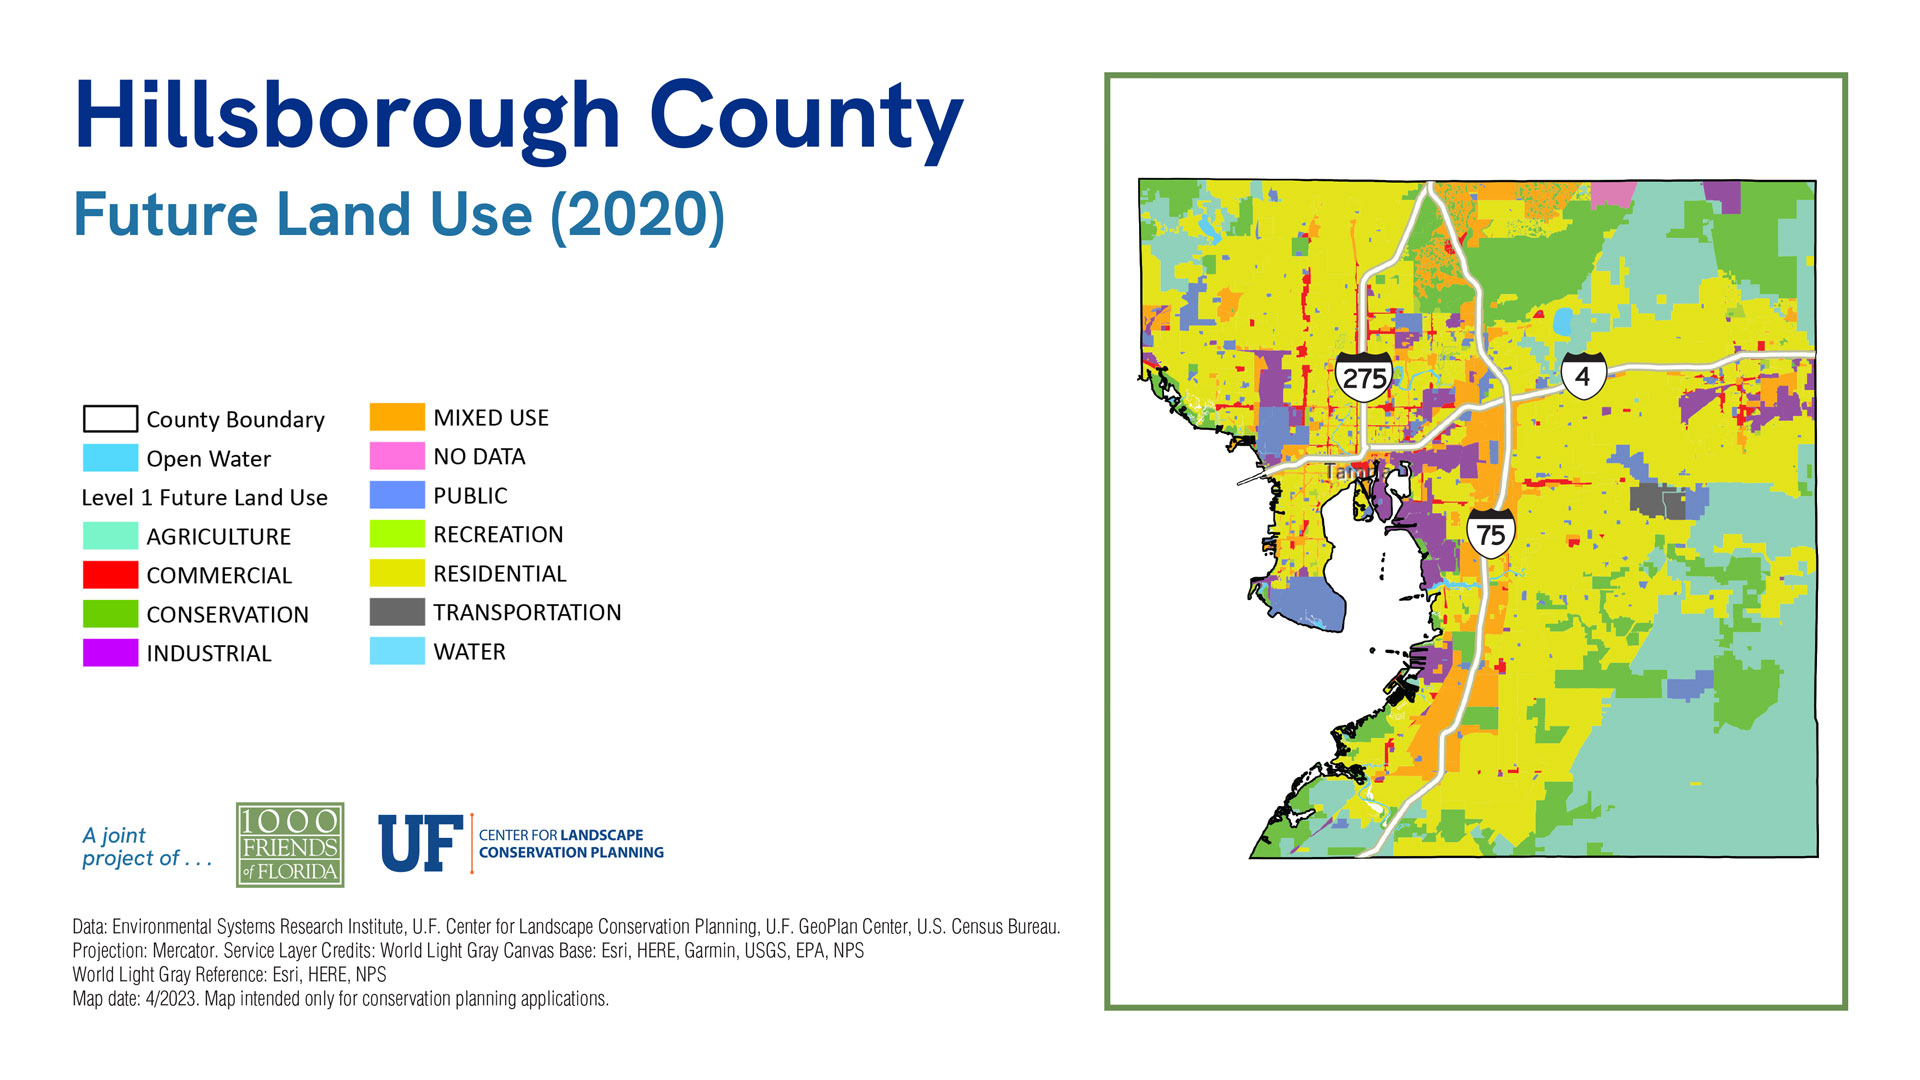
County Maps
Hillsborough County
Sea Level 2040:
Baseline
2040 Sprawl
2040 Conservation
| 2019 | % of Total Acreage | Sprawl 2040 | % of Total Acreage | Conservation 2040 | % of Total Acreage | |
|---|---|---|---|---|---|---|
| Developed | 235,823 | 34.38% | 284,921 | 41.54% | 272,783 | 39.77% |
| Protected Natural Land | 83,599 | 12.19% | 79,440 | 11.58% | 80,321 | 11.71% |
| Protected Agriculture | 25,898 | 3.78% | 25,866 | 3.77% | 26,108 | 3.81% |
| Agriculture | 95,657 | 13.95% | 68,842 | 10.04% | 76,786 | 11.20% |
| Other* | 199,838 | 29.14% | 174,636 | 25.46% | 177,707 | 25.91% |
| 2019 Open Water | 45,079 | 6.57% | 45,079 | 6.57% | 45,079 | 6.57% |
| Sea Level Inundation: Protected Lands | 0 | 0.00% | 4,191 | 0.61% | 4,191 | 0.61% |
| Sea Level Inundation: All Other Land Uses | 0 | 0.00% | 2,919 | 0.43% | 2,919 | 0.43% |
| Total Acreage | 685,894 | 100.00% | 685,894 | 100.00% | 685,894 | 100.00% |
| Total Land Acreage | 640,815 | 93.43% | 633,705 | 92.39% | 633,705 | 92.39% |
| Total Open Water including SLR | 45,079 | 6.57% | 52,189 | 7.61% | 52,189 | 7.61% |
| Total Sea Level Inundation | 0 | 0.00% | 7,110 | 1.04% | 7,110 | 1.04% |
Population
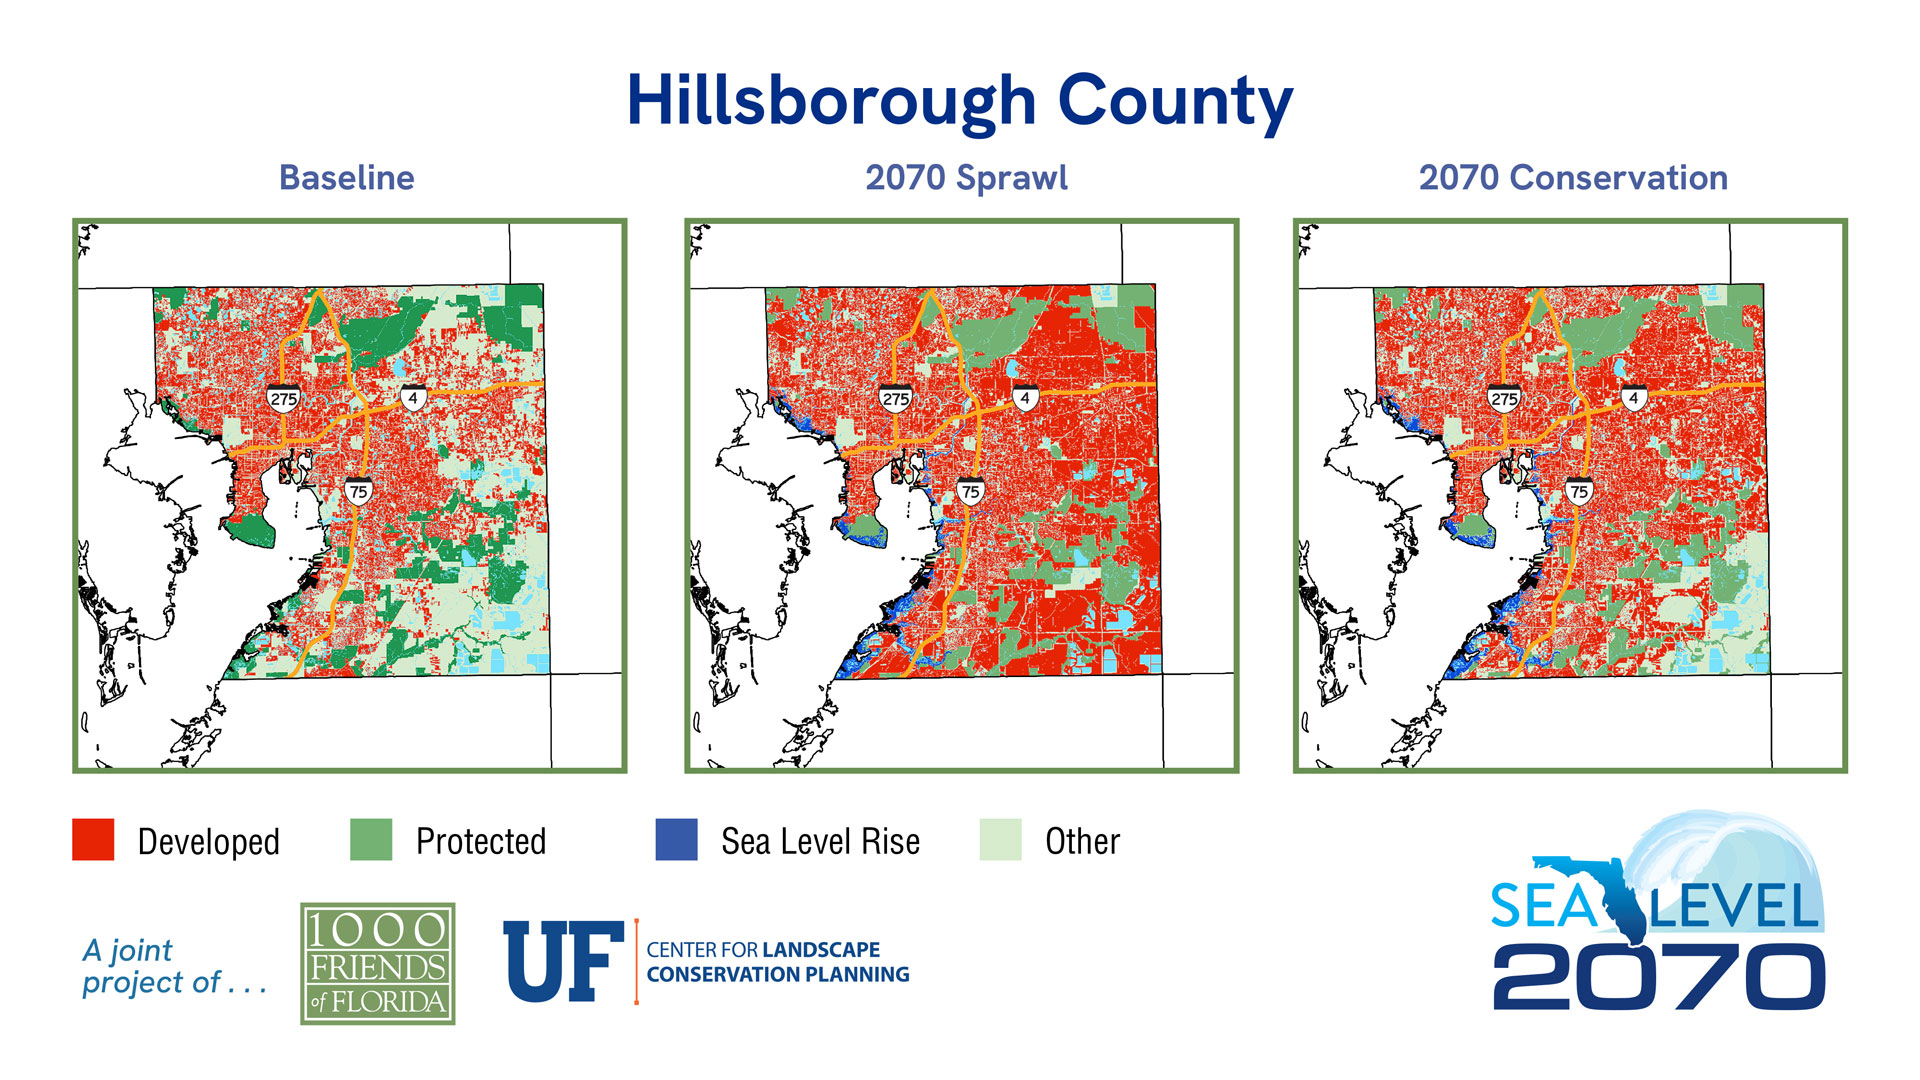
Sea Level 2070:
Baseline
2070 Sprawl
2070 Conservation
| 2019 | % of Total Acreage | Sprawl 2070 | % of Total Acreage | Conservation 2070 | % of Total Acreage | |
|---|---|---|---|---|---|---|
| Developed | 235,823 | 34.38% | 398,293 | 58.07% | 326,971 | 47.67% |
| Protected Natural Land | 83,599 | 12.19% | 74,480 | 10.86% | 75,361 | 10.99% |
| Protected Agriculture | 25,898 | 3.78% | 25,520 | 3.72% | 242 | 0.04% |
| Agriculture | 95,657 | 13.95% | 10,756 | 1.57% | 41,433 | 6.04% |
| Other* | 199,838 | 29.14% | 117,533 | 17.14% | 182,575 | 26.62% |
| 2019 Open Water | 45,079 | 6.57% | 45,079 | 6.57% | 45,079 | 6.57% |
| Sea Level Inundation: Protected Lands | 0 | 0.00% | 8,173 | 1.19% | 8,173 | 1.19% |
| Sea Level Inundation: All Other Land Uses | 0 | 0.00% | 6,060 | 0.88% | 6,060 | 0.88% |
| Total Acreage | 685,894 | 100.00% | 685,894 | 100.00% | 685,894 | 100.00% |
| Total Land Acreage | 640,815 | 93.43% | 626,582 | 91.35% | 626,582 | 91.35% |
| Total Open Water including SLR | 45,079 | 6.57% | 59,312 | 8.65% | 59,312 | 8.65% |
| Total Sea Level Inundation | 0 | 0.00% | 14,233 | 2.08% | 14,233 | 2.08% |


