County Maps
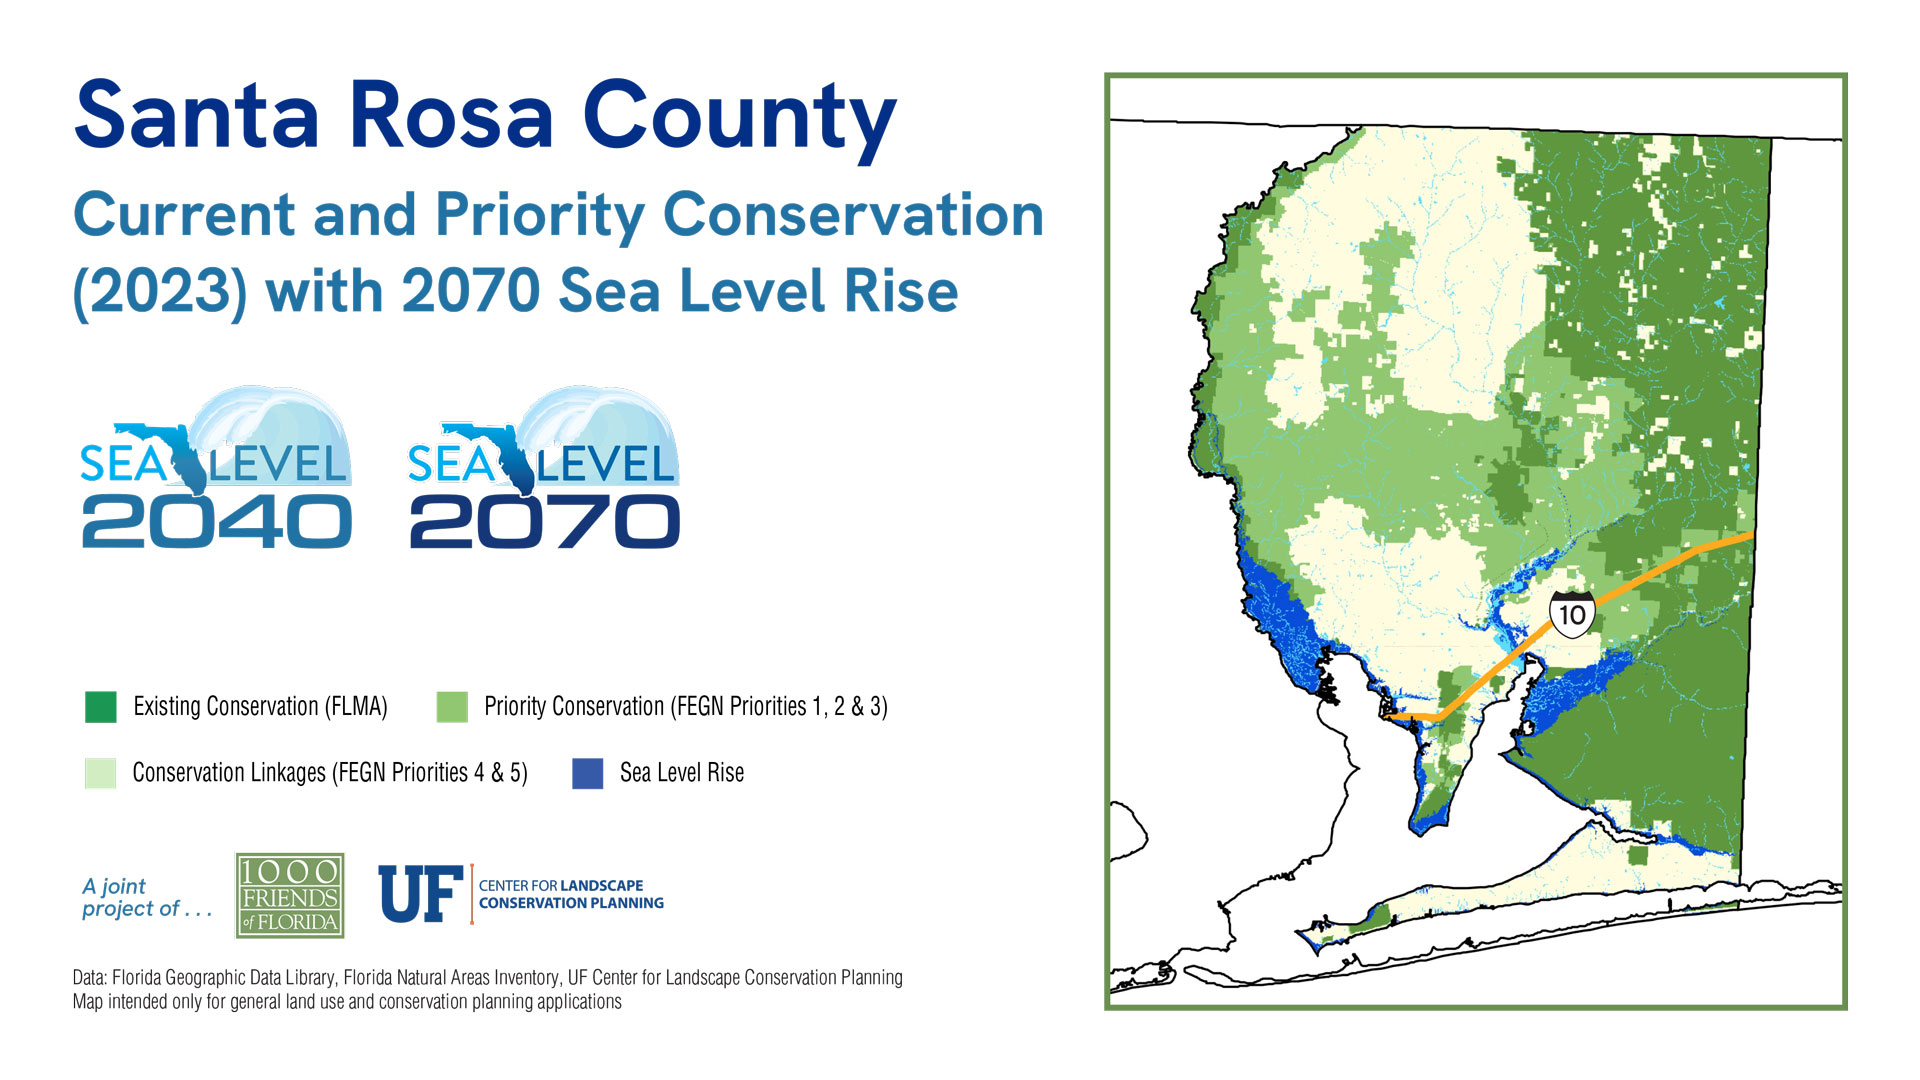
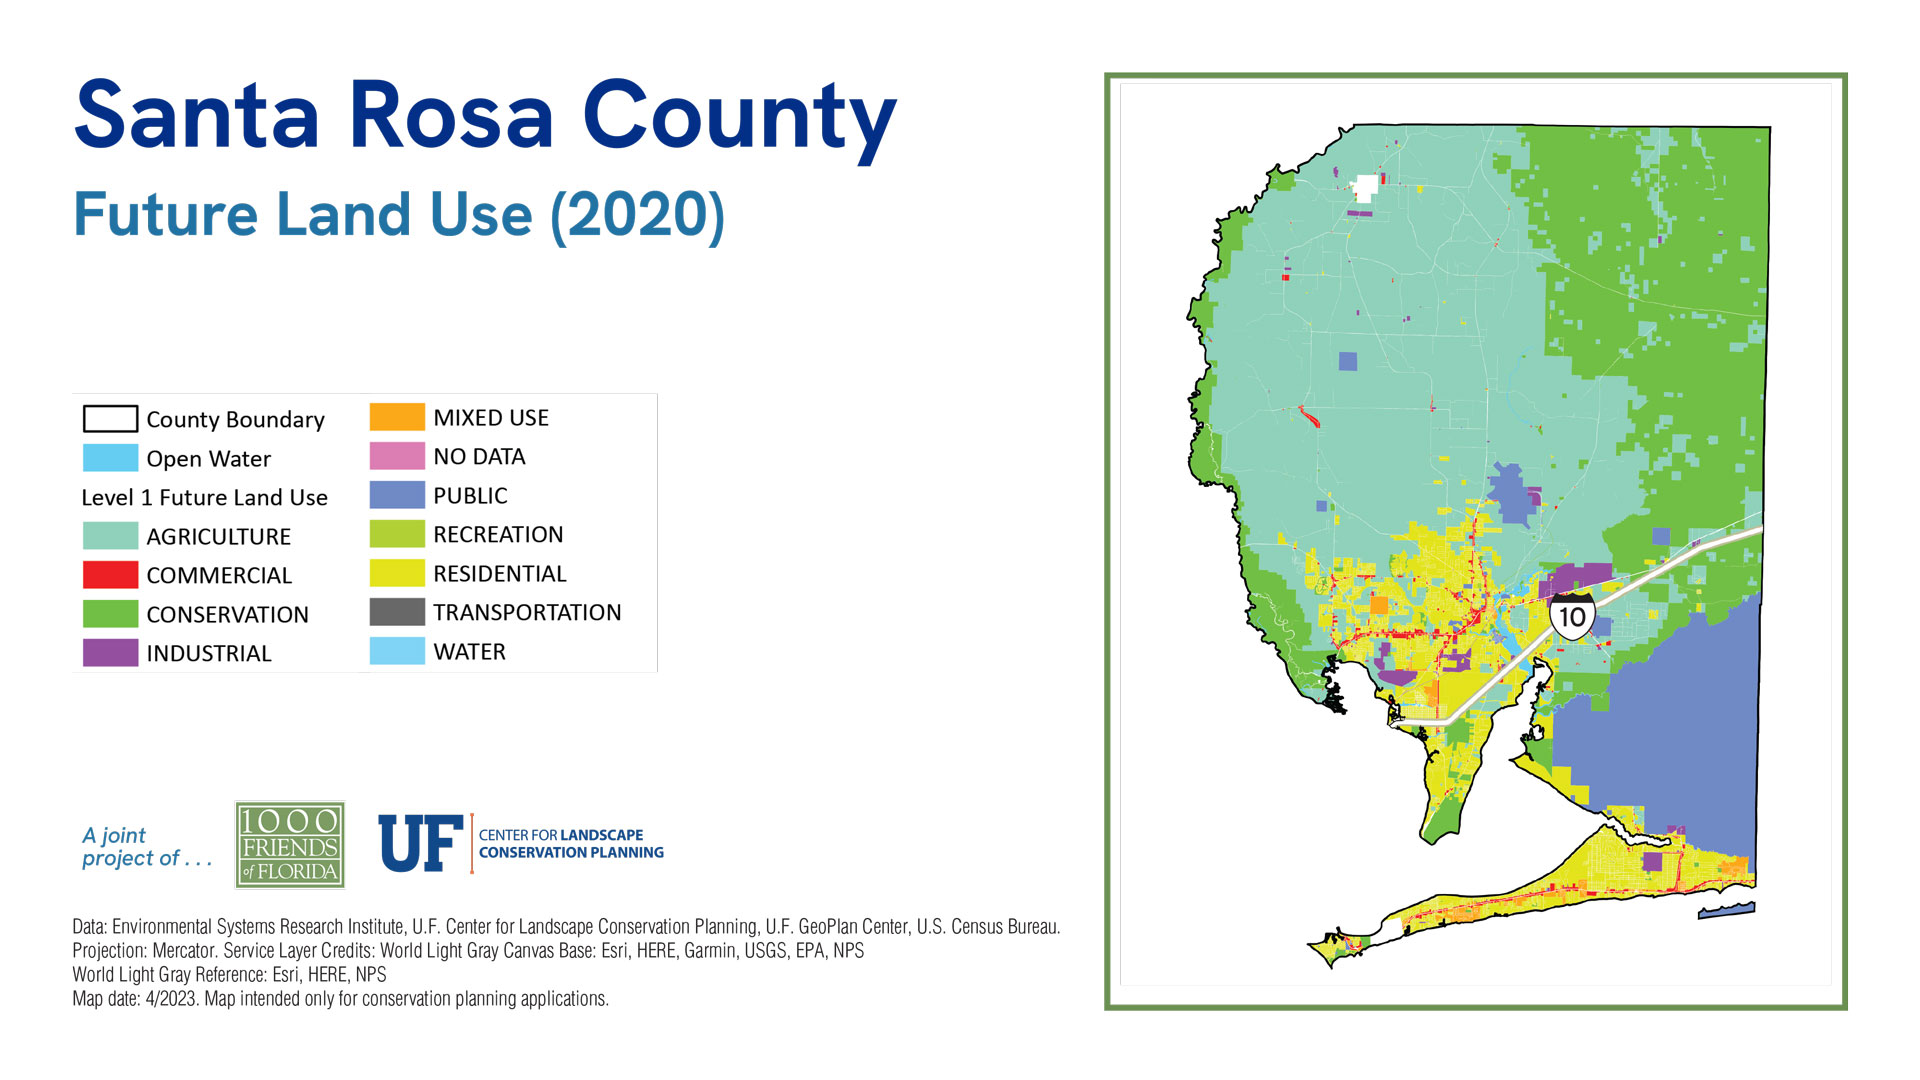
Santa Rosa County
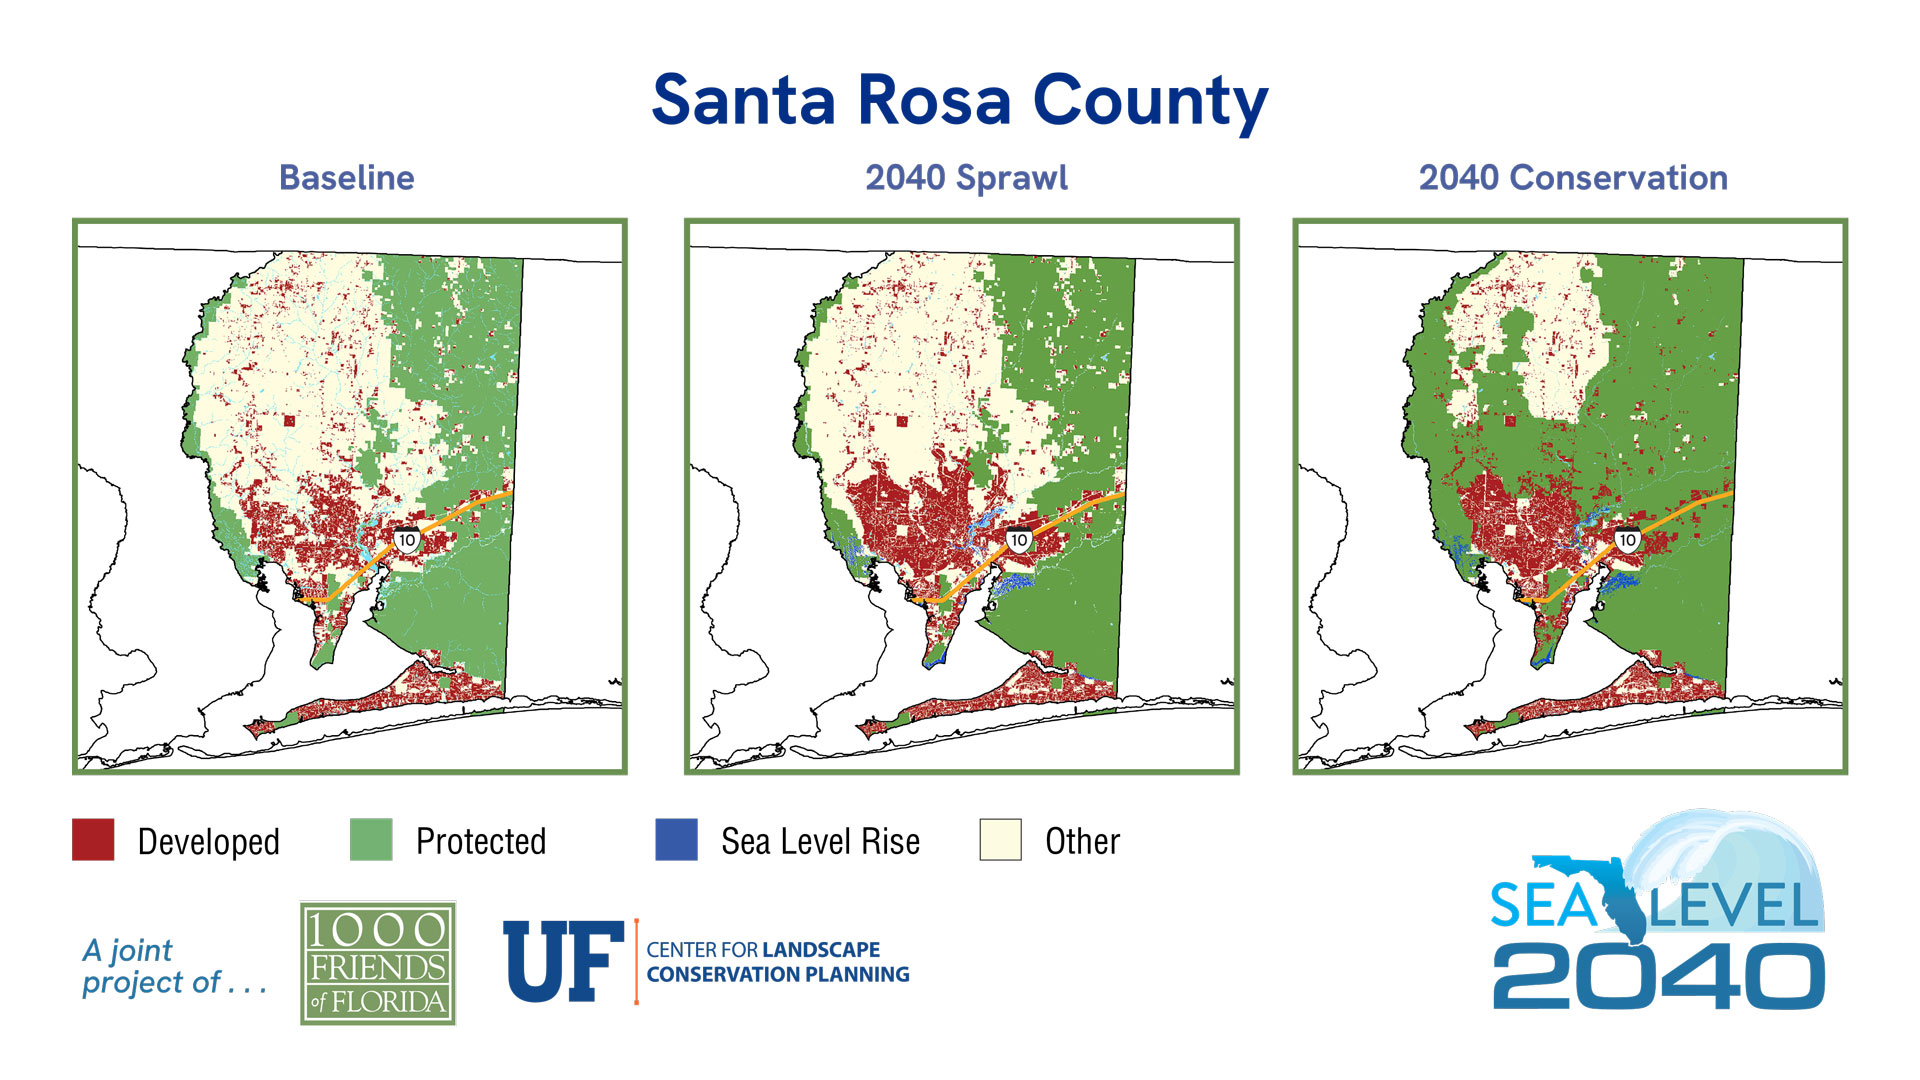
Sea Level 2040:
Baseline
2040 Sprawl
2040 Conservation
| 2019 | % of Total Acreage | Sprawl 2040 | % of Total Acreage | Conservation 2040 | % of Total Acreage | |
|---|---|---|---|---|---|---|
| Developed | 86,032 | 13.11% | 107,060 | 16.31% | 101,645 | 15.48% |
| Protected Natural Land | 257,694 | 39.25% | 254,332 | 38.74% | 381,318 | 58.09% |
| Protected Agriculture | 870 | 0.13% | 870 | 0.13% | 13,184 | 2.01% |
| Agriculture | 65,170 | 9.93% | 62,357 | 9.50% | 50,163 | 7.64% |
| Other* | 239,938 | 36.55% | 220,122 | 33.53% | 98,432 | 14.99% |
| 2019 Open Water | 6,762 | 1.03% | 6,762 | 1.03% | 6,762 | 1.03% |
| Sea Level Inundation: Protected Lands | 0 | 0.00% | 3,362 | 0.51% | 3,802 | 0.58% |
| Sea Level Inundation: All Other Land Uses | 0 | 0.00% | 1,601 | 0.24% | 1,160 | 0.18% |
| Total Acreage | 656,466 | 100.00% | 656,466 | 100.00% | 656,466 | 100.00% |
| Total Land Acreage | 649,704 | 98.97% | 644,741 | 98.21% | 644,742 | 98.21% |
| Total Open Water including SLR | 6,762 | 1.03% | 11,725 | 1.79% | 11,724 | 1.79% |
| Total Sea Level Inundation | 0 | 0.00% | 4,963 | 0.76% | 4,962 | 0.76% |
Population
Sea Level 2070:
Baseline
2070 Sprawl
2070 Conservation
| 2019 | % of Total Acreage | Sprawl 2070 | % of Total Acreage | Conservation 2070 | % of Total Acreage | |
|---|---|---|---|---|---|---|
| Developed | 86,032 | 13.11% | 136,396 | 20.78% | 119,942 | 18.27% |
| Protected Natural Land | 257,694 | 39.25% | 241,319 | 36.76% | 367,485 | 55.98% |
| Protected Agriculture | 870 | 0.13% | 870 | 0.13% | 13,161 | 2.00% |
| Agriculture | 65,170 | 9.93% | 54,501 | 8.30% | 42,076 | 6.41% |
| Other* | 239,938 | 36.55% | 194,768 | 29.67% | 85,190 | 12.98% |
| 2019 Open Water | 6,762 | 1.03% | 6,762 | 1.03% | 6,762 | 1.03% |
| Sea Level Inundation: Protected Lands | 0 | 0.00% | 14,734 | 2.24% | 15,885 | 2.42% |
| Sea Level Inundation: All Other Land Uses | 0 | 0.00% | 7,116 | 1.08% | 5,966 | 0.91% |
| Total Acreage | 656,466 | 100.00% | 656,466 | 100.00% | 656,466 | 100.00% |
| Total Land Acreage | 649,704 | 98.97% | 627,854 | 95.64% | 627,854 | 95.64% |
| Total Open Water including SLR | 6,762 | 1.03% | 28,612 | 4.36% | 28,613 | 4.36% |
| Total Sea Level Inundation | 0 | 0.00% | 21,850 | 3.33% | 21,851 | 3.33% |


