County Maps
Nassau County
Sea Level 2040:
Baseline
2040 Sprawl
2040 Conservation
| 2019 | % of Total Acreage | Sprawl 2040 | % of Total Acreage | Conservation 2040 | % of Total Acreage | |
|---|---|---|---|---|---|---|
| Developed | 61,668 | 14.49% | 84,407 | 19.83% | 78,794 | 18.51% |
| Protected Natural Land | 29,407 | 6.91% | 25,031 | 5.88% | 37,343 | 8.77% |
| Protected Agriculture | 324 | 0.08% | 324 | 0.08% | 1,053 | 0.25% |
| Agriculture | 16,906 | 3.97% | 16,655 | 3.91% | 15,934 | 3.74% |
| Other* | 312,364 | 73.39% | 257,684 | 60.54% | 250,977 | 58.96% |
| 2019 Open Water | 4,976 | 1.17% | 4,976 | 1.17% | 4,976 | 1.17% |
| Sea Level Inundation: Protected Lands | 0 | 0.00% | 4,375 | 1.03% | 8,006 | 1.88% |
| Sea Level Inundation: All Other Land Uses | 0 | 0.00% | 32,193 | 7.56% | 28,562 | 6.71% |
| Total Acreage | 425,645 | 100.00% | 425,645 | 100.00% | 425,645 | 100.00% |
| Total Land Acreage | 420,669 | 98.83% | 384,101 | 90.24% | 384,101 | 90.24% |
| Total Open Water including SLR | 4,976 | 1.17% | 41,544 | 9.76% | 41,544 | 9.76% |
| Total Sea Level Inundation | 0 | 0.00% | 36,568 | 8.59% | 36,568 | 8.59% |
Population
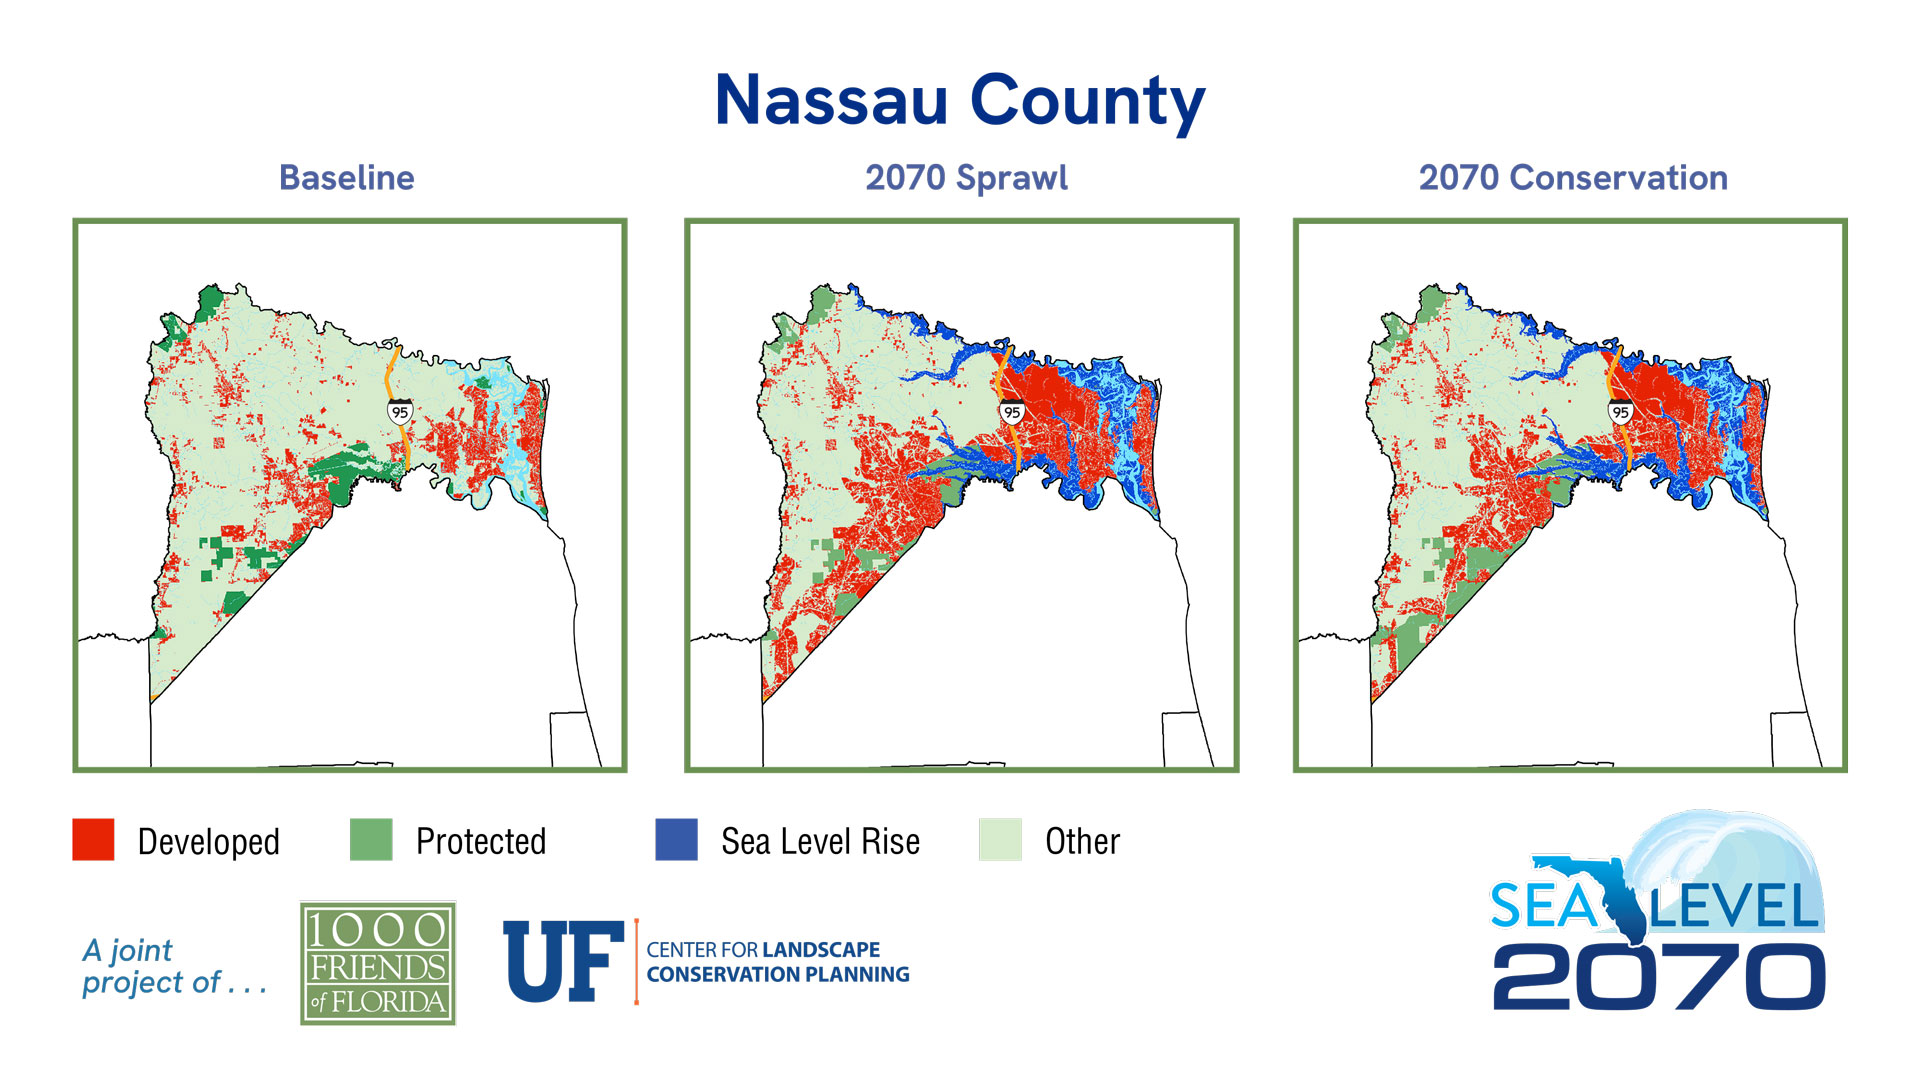
Sea Level 2070:
Baseline
2070 Sprawl
2070 Conservation
| 2019 | % of Total Acreage | Sprawl 2070 | % of Total Acreage | Conservation 2070 | % of Total Acreage | |
|---|---|---|---|---|---|---|
| Developed | 61,668 | 14.49% | 123,352 | 28.98% | 106,484 | 25.02% |
| Protected Natural Land | 29,407 | 6.91% | 22,627 | 5.32% | 34,449 | 8.09% |
| Protected Agriculture | 324 | 0.08% | 291 | 0.07% | 721 | 0.17% |
| Agriculture | 16,906 | 3.97% | 11,552 | 2.71% | 12,131 | 2.85% |
| Other* | 312,364 | 73.39% | 221,729 | 52.09% | 225,766 | 53.04% |
| 2019 Open Water | 4,976 | 1.17% | 4,976 | 1.17% | 4,976 | 1.17% |
| Sea Level Inundation: Protected Lands | 0 | 0.00% | 6,602 | 1.55% | 10,341 | 2.43% |
| Sea Level Inundation: All Other Land Uses | 0 | 0.00% | 34,516 | 8.11% | 30,777 | 7.23% |
| Total Acreage | 425,645 | 100.00% | 425,645 | 100.00% | 425,645 | 100.00% |
| Total Land Acreage | 420,669 | 98.83% | 379,551 | 89.17% | 379,551 | 89.17% |
| Total Open Water including SLR | 4,976 | 1.17% | 46,094 | 10.83% | 46,094 | 10.83% |
| Total Sea Level Inundation | 0 | 0.00% | 41,118 | 9.66% | 41,118 | 9.66% |


